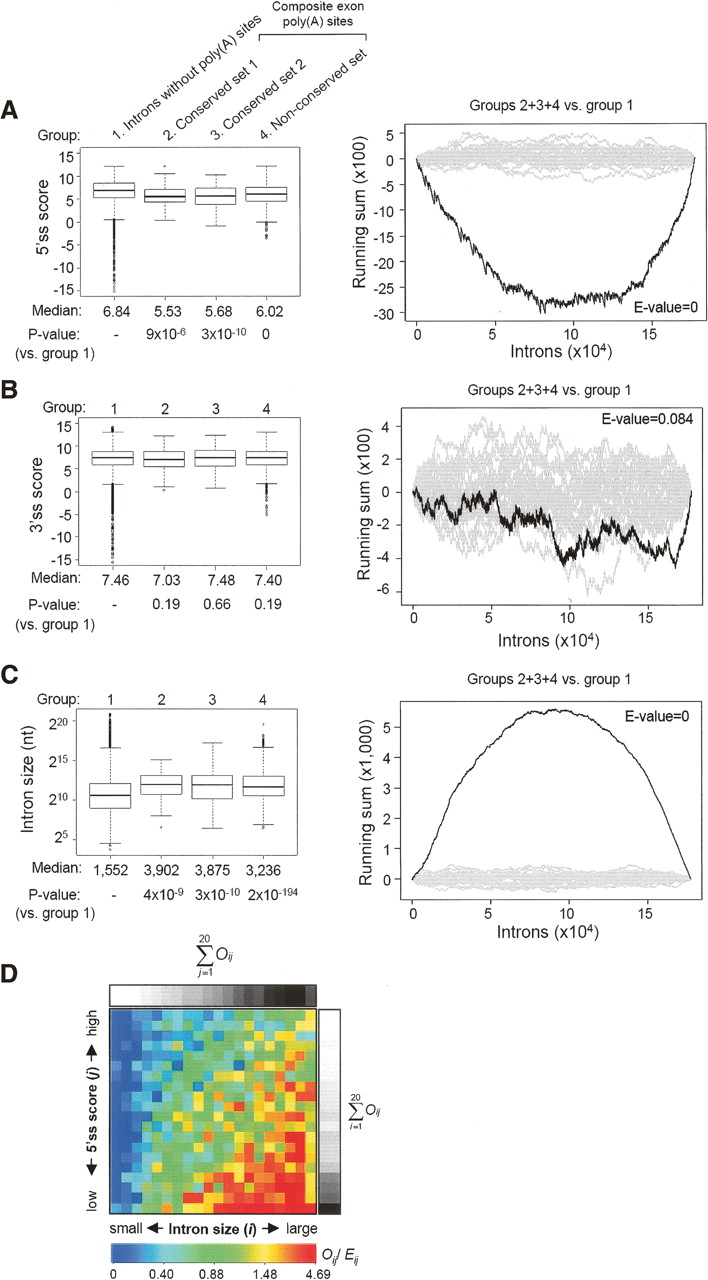
Characteristics of introns containing composite exon poly(A) sites. (A) Boxplots of 5′ss scores for four groups of introns (left) and a mKS test result (right) comparing introns without poly(A) sites with introns with composite exon poly(A) sites with respect to 5′ss scores. (B) As in A except that 3′ss scores are plotted and compared. (C) As in A except that intron sizes are plotted and compared. For boxplots, median values and P-values from the Wilcoxon tests comparing each group with group 1 are shown. For mKS tests, the E-values are expected values as described in Methods. The E-values for A and B represent the probability of getting smaller values in groups 2 + 3 + 4 than in group 1 by random chance, and the E-value for C represents the probability of getting higher values in groups 2 + 3 + 4 than in group 1 by random chance. In each graph, the black line is the running sum of the real data, and the gray lines are 25 randomly selected running sums from 1000 randomized data. (D) Intron distribution map for introns with composite exon poly(A) sites. x-axis is intron size (i) from small to large, and Y-axis is 5′ss score (j) from low to high, as indicated in the graph. The ratios of observed values to expected ones (Oij/Eij) are shown in a heatmap, where colors are used to represent values according to the color scale under the graph. The row sum ∑20i=1Oij and column sum ∑20j=1Oij are also shown in grayscale bars presented next to and above the graph, respectively, with black representing the highest value and white representing the lowest value.