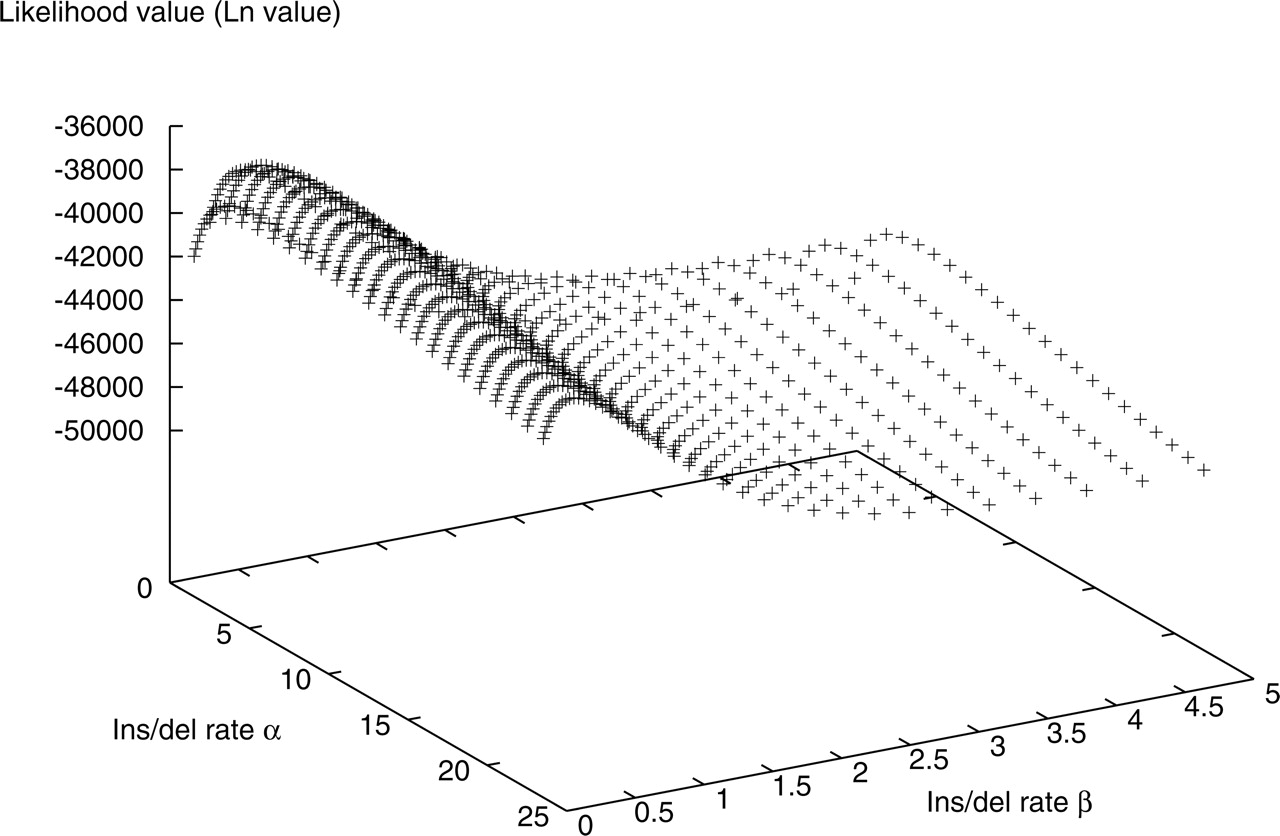
Figure 3.
An example of the likelihood surface with different rates of insertion and deletion. The likelihood value shows a continuous pattern of change as the insertion/deletion rate changes.
An example of the likelihood surface with different rates of insertion and deletion. The likelihood value shows a continuous pattern of change as the insertion/deletion rate changes.