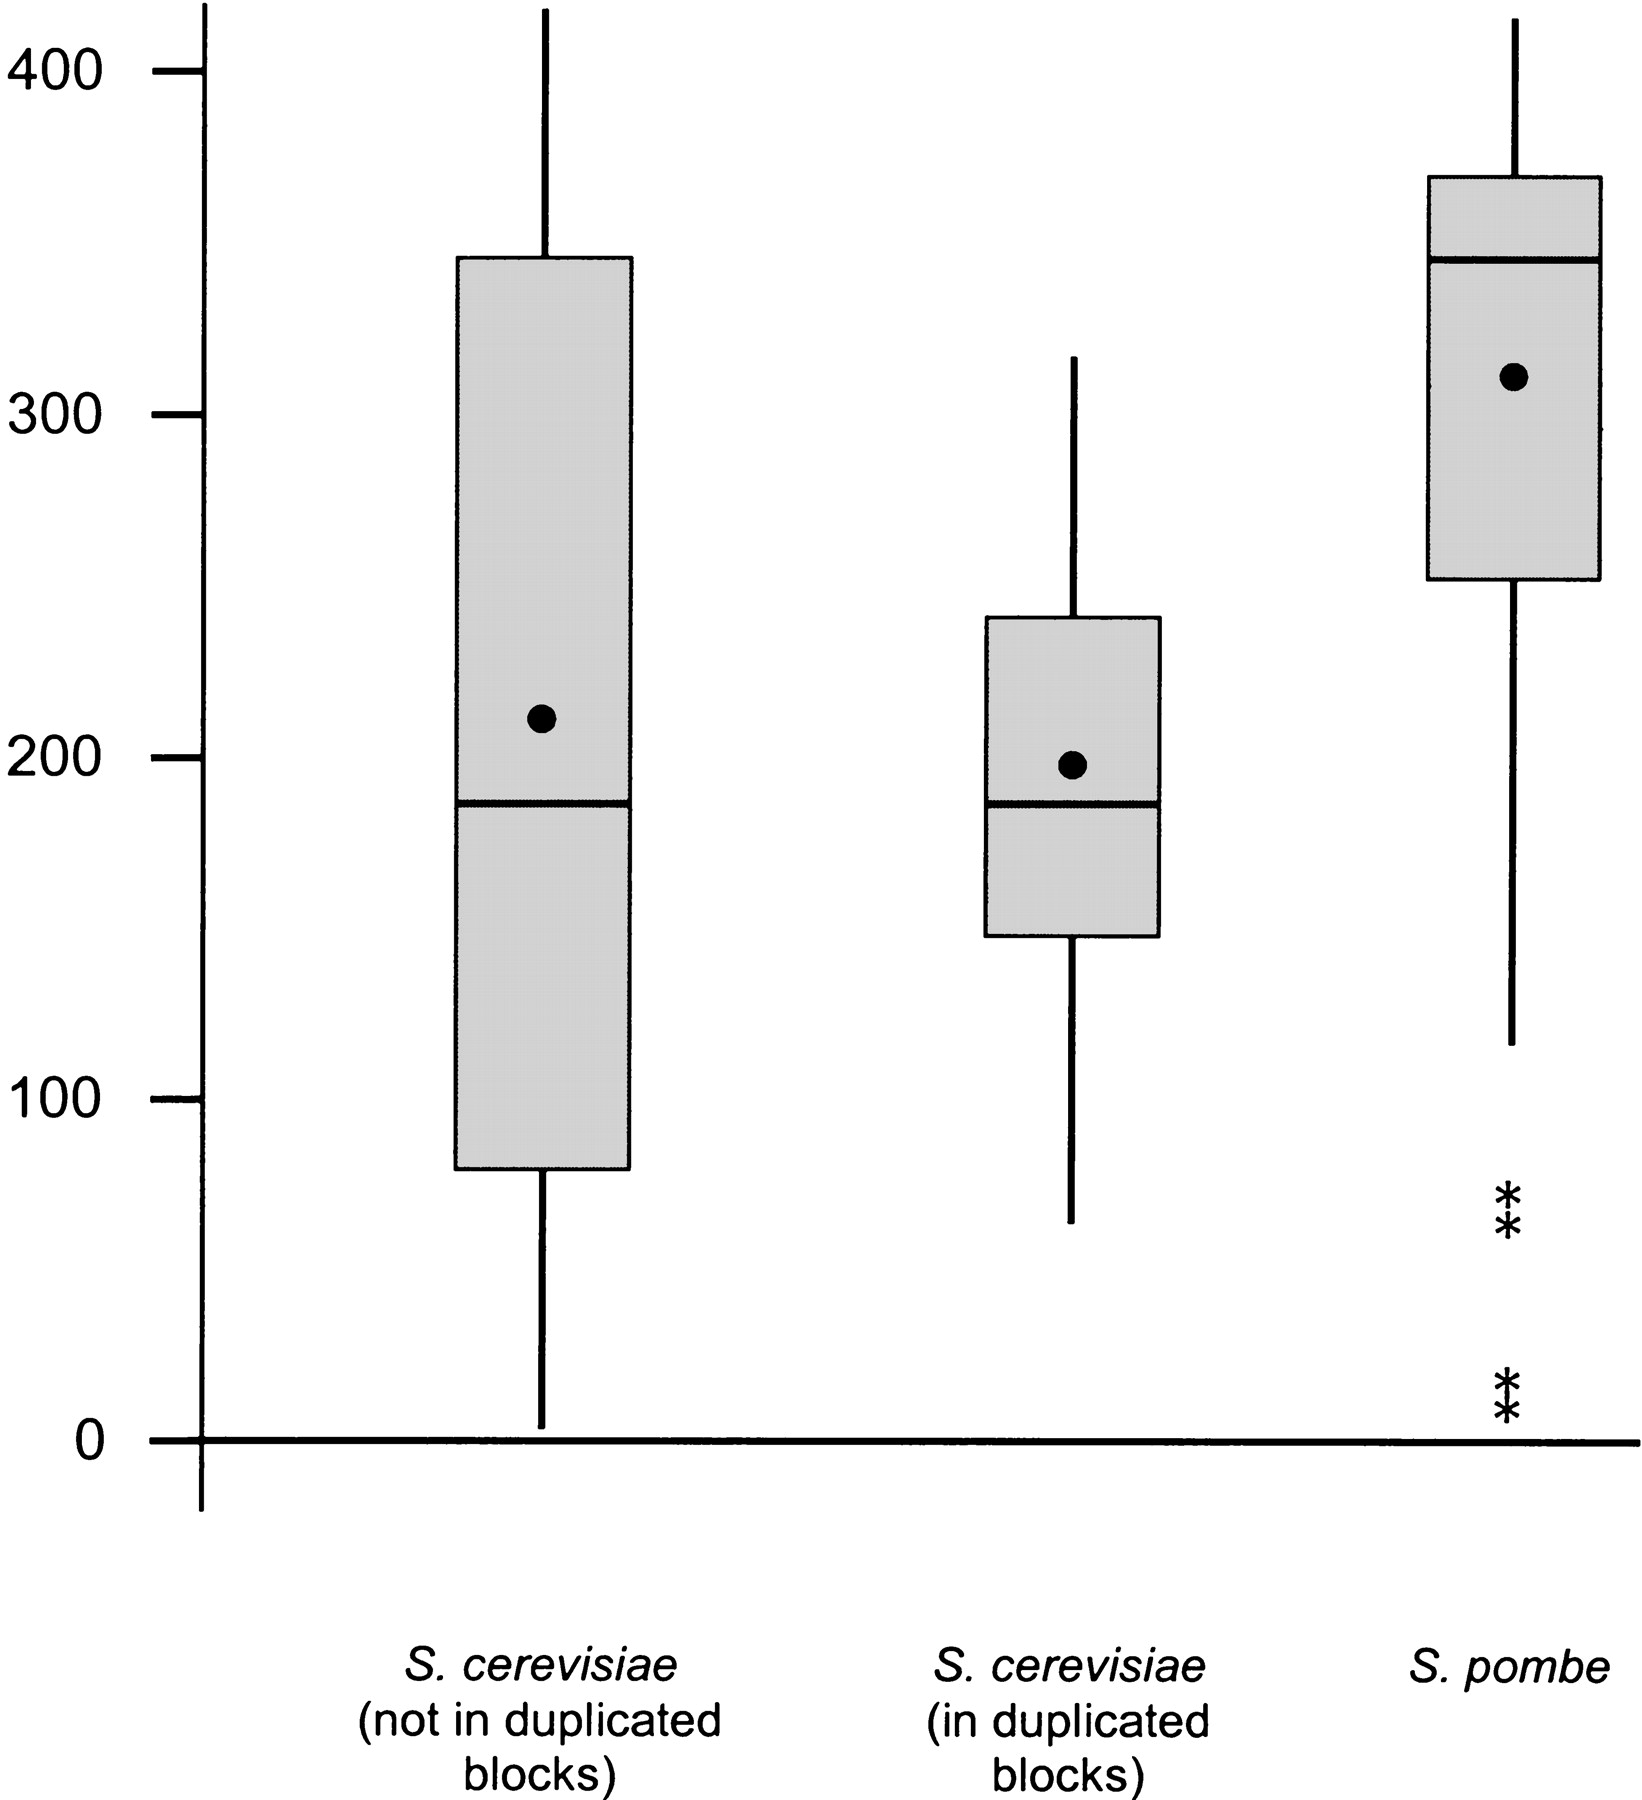
Box-and-whiskers plots of estimated duplication times for gene pairs duplicated after the last common ancestor of Schizosaccharomyces pombe and Saccharomyces cerevisiae, grouped as follows: (1) 48 duplications in S. cerevisiae of genes that are not elements of duplicated genomic blocks; (2) 39 duplications in S. cerevisiae of genes that are elements of duplicated genomic blocks; and (3) 46 duplications in S. pombe. The hypothesis of an equal variance in all three groups was rejected (Levene's test;P = 0.004). However, the hypothesis of equal variance inS. cerevisiae duplications not in blocks and S. pombeduplications could not be rejected (Levene's test). One-way analysis of variance showed a significant difference in mean duplication time between the three groups (P < 0.001), and the Kruskal-Wallis test showed a significant difference in median duplication times among the three groups (P < 0.001). In each plot, the box covers the range between the first (Q 1) and third (Q 3) quartiles in the data. A horizontal line indicates the median, and a dot the mean. The vertical lines (“whiskers”) cover the range fromQ 1 − 1.5 (Q 3–Q 1) toQ 3 + 1.5 (Q 3–Q 1). Outliers are indicated by asterisks.