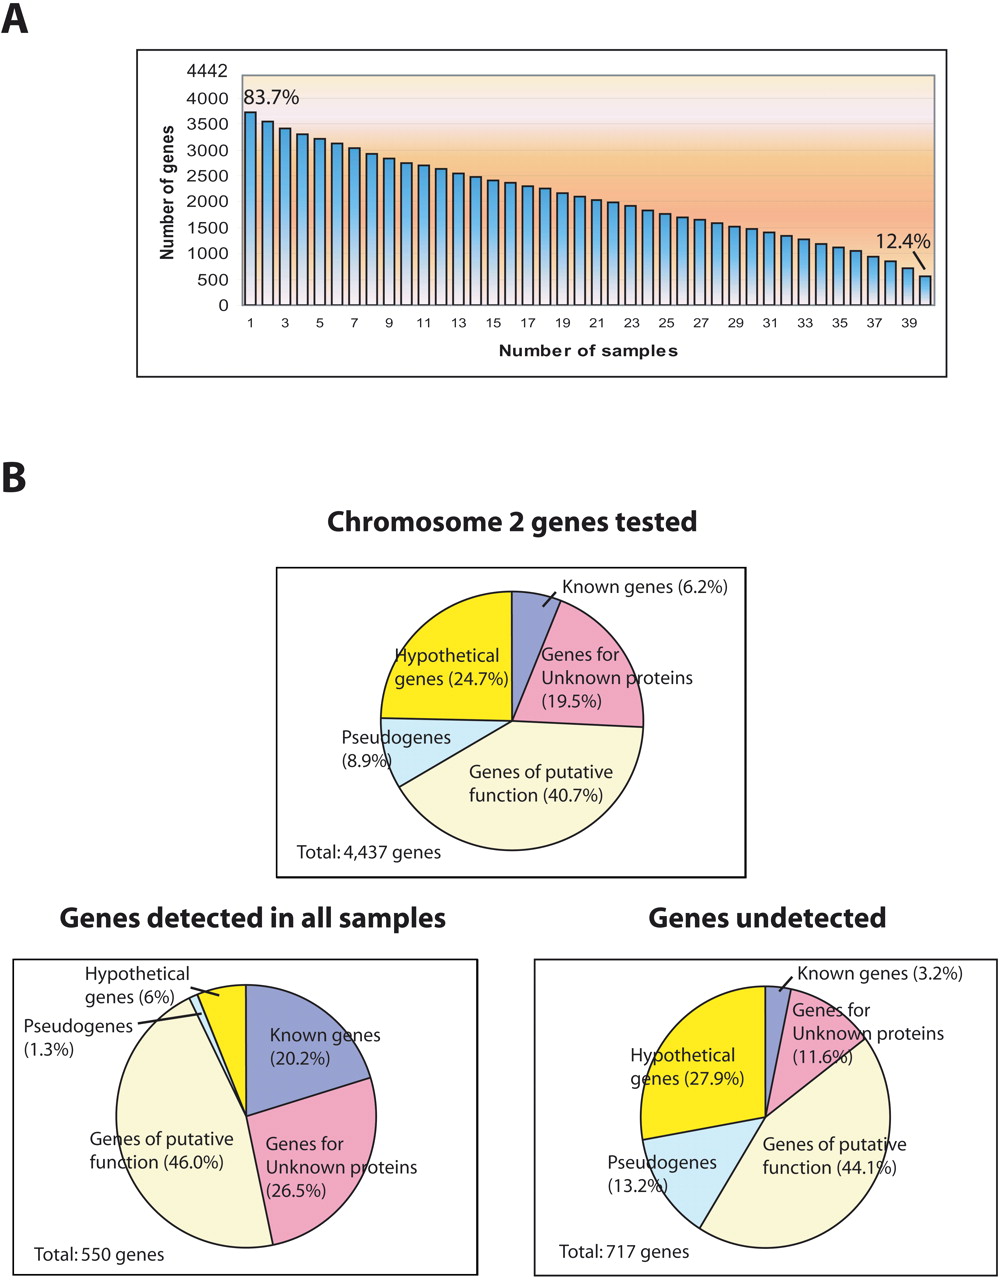
Figure 3.
Validation of gene predictions by expression as detected by microarray analysis. (A) Various levels of support can be inferred based on how often expression was detected in the 40 assays performed. Of 4437 genes surveyed, 83.7% provides evidence of expression in at least one assay, while 12.4% are expressed in all assays. (B) Genes assigned to functional classes, shown for the chromosome and for those genes that were expressed in every sample or that failed to be detected in any assay. Genes of previously known function are relatively overrepresented among those ubiquitously expressed and underrepresented among those not detected, while “hypothetical” genes display the opposite behavior.