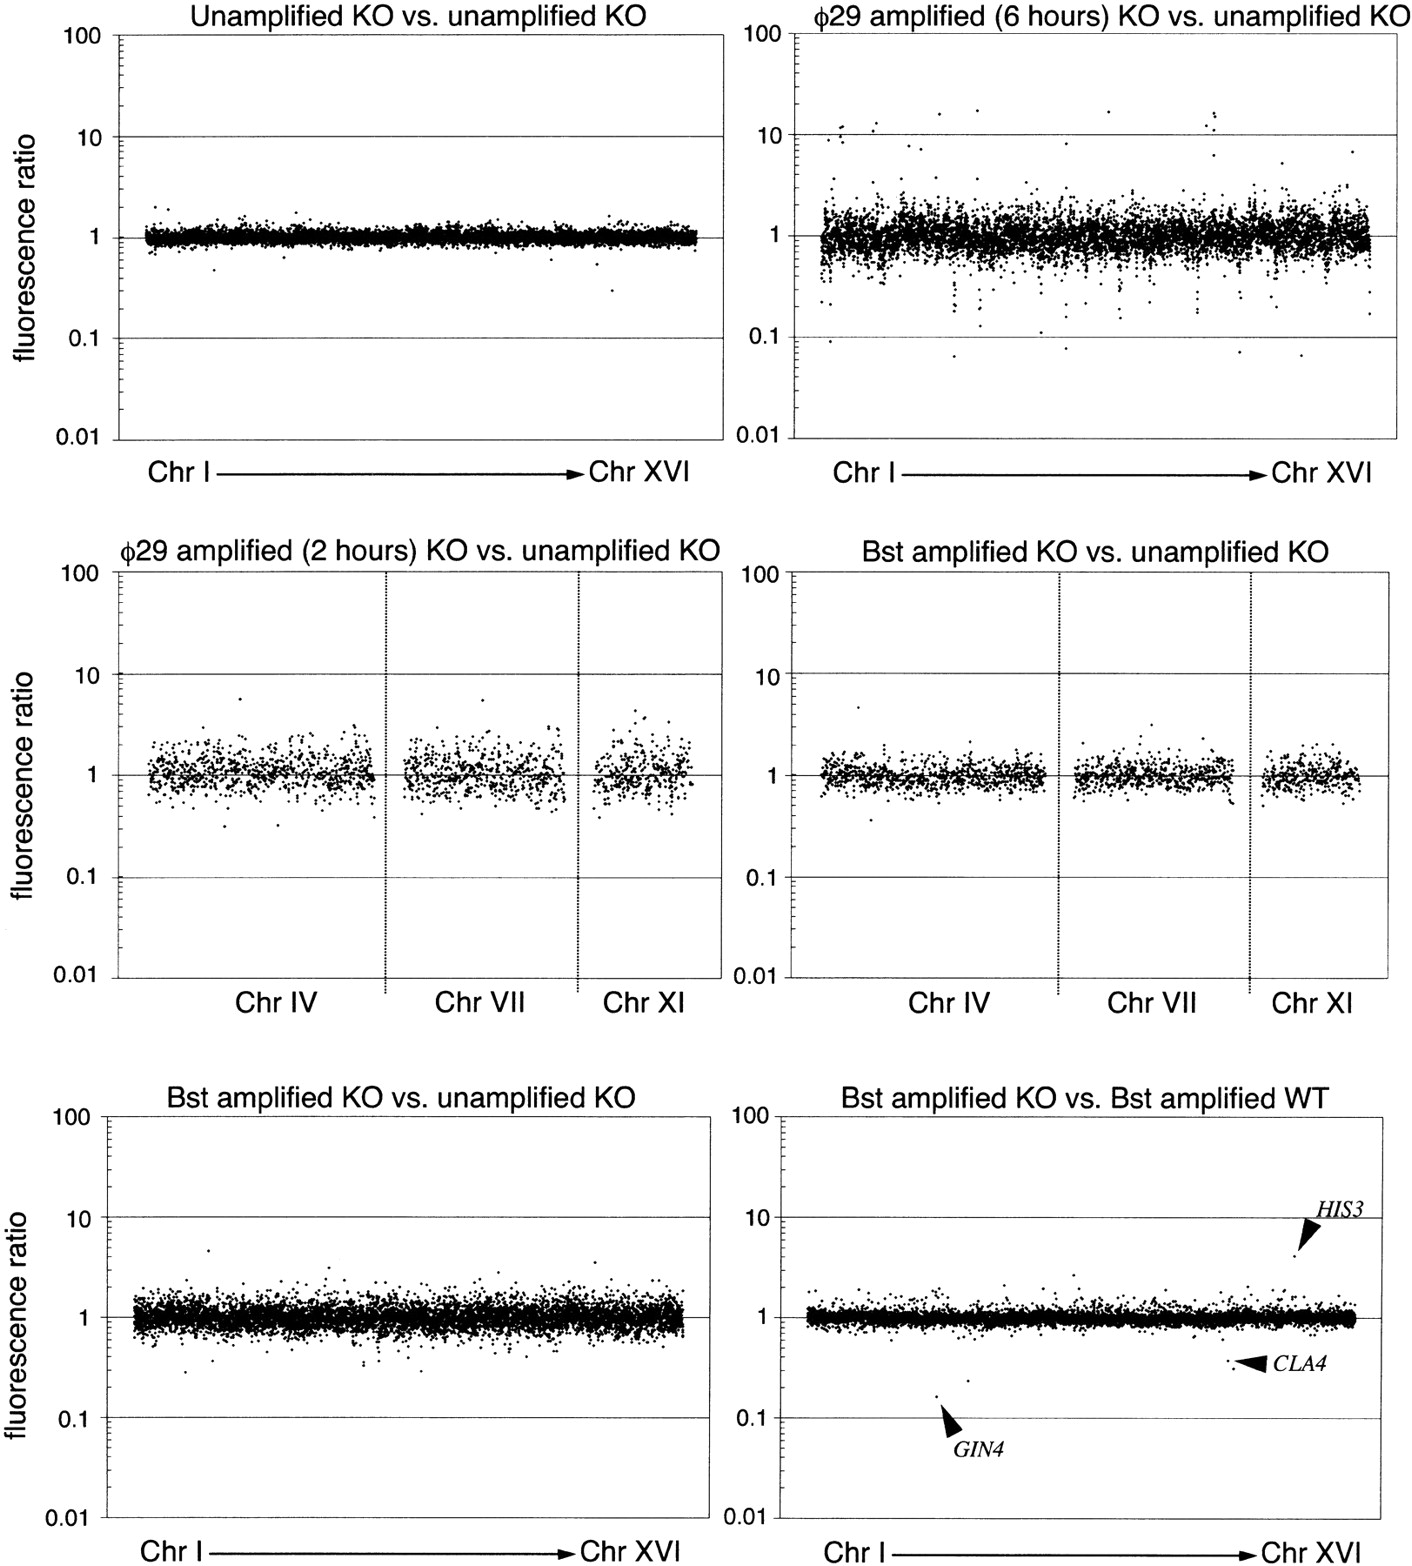
Evaluation of amplification bias using array–CGH on yeast cDNA microarrays. Microarrays contained 6135 unique yeast ORFs. Fluorescence ratios were measured and plotted against the order of the genes in the genome, starting from Chromosome I to Chromosome XVI. (Upper left panel) Analysis of a microarray hybridized with the same DNA, labeled with Cy3 and Cy5. (Upper right panel) DNA from the yeast KO strain was amplified using φ29 DNA polymerase, labeled with Cy3, and hybridized against unamplified (Cy5) DNA from the same strain. (Lower left panel) DNA from the yeast KO strain was amplified using Bst DNA polymerase, labeled with Cy3, and hybridized against unamplified (Cy5) DNA from the same strain. (Center left panel) DNA from the yeast KO strain was amplified using φ29 DNA polymerase for only 2 h, labeled with Cy3, and hybridized against unamplified (Cy5) DNA from the same strain. (Center rightpanel) Equivalent experiment using Bst DNA polymerase. (Lower right panel) DNAs from the two different yeast strains were amplified to the same extent using Bst and hybridized together. The three genes known to be deleted appear as outlier data points indicated by arrows. The other two outlier data points, near genes GIN4 and CLA4, have abnormally low area values of 48 and 21 according to the Spot analysis software, compared with the average of 255 for all the spots in the array. This abnormality could be produced by a fluorescent speckle over the spot, resulting in unreliable ratios.