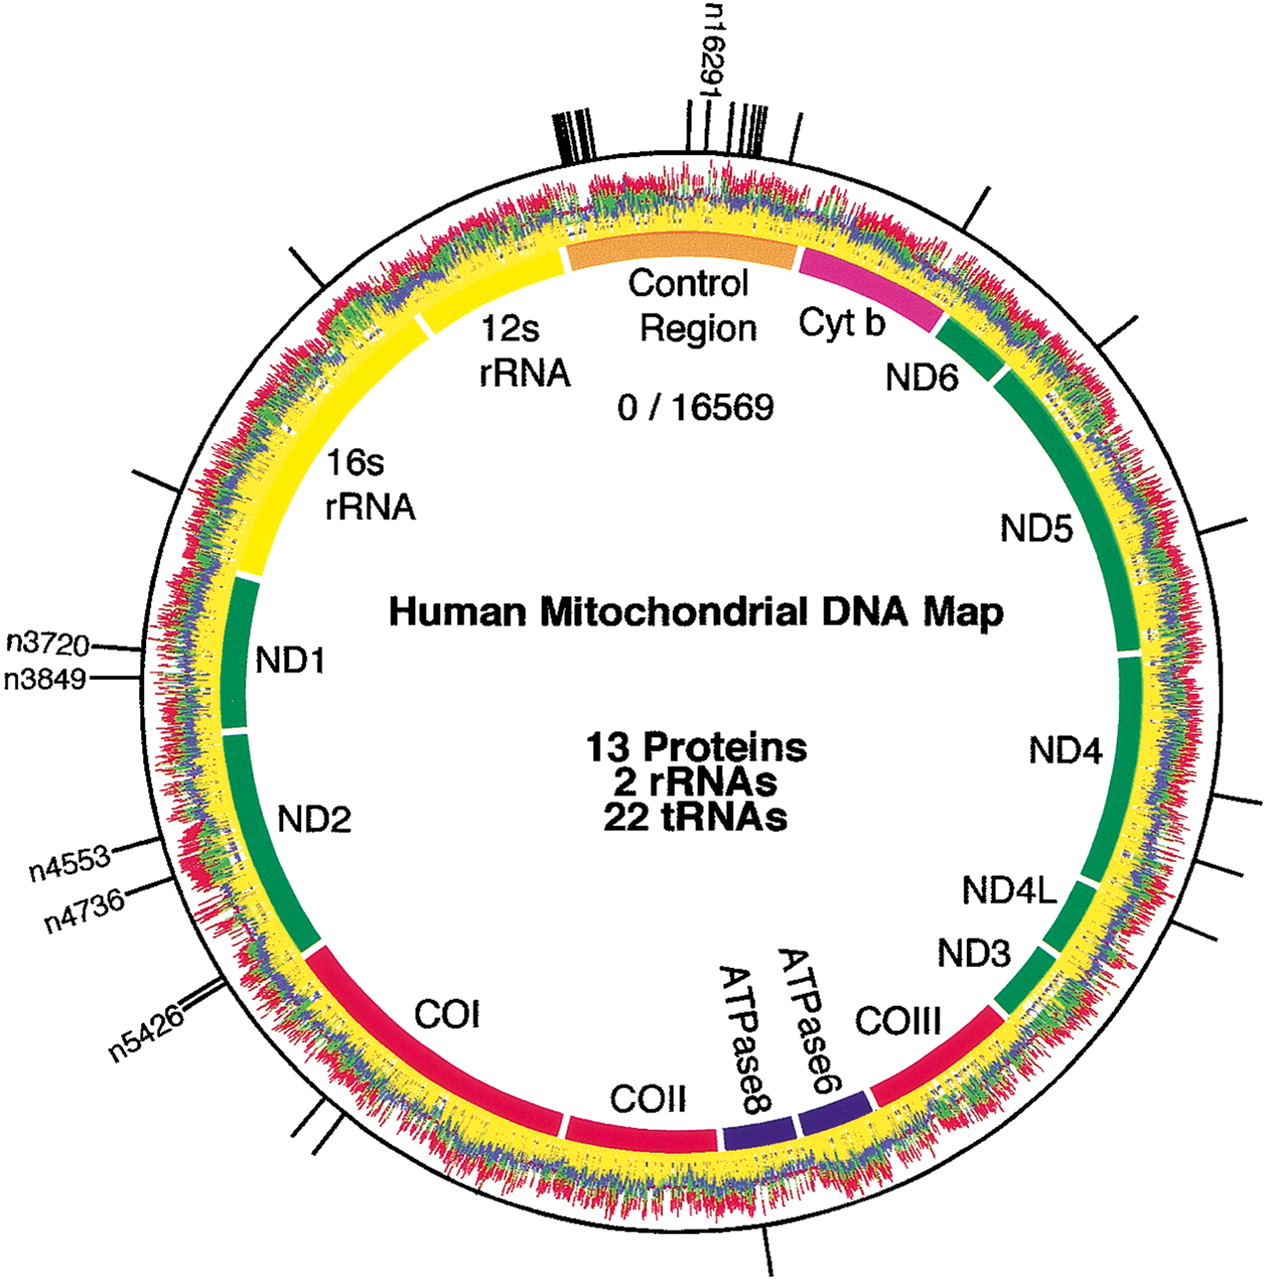
Figure 3.
Whole mitochondrial genome analysis. Genomic PRS data is presented wrapped around a map of the human mitochondrial genome. For clarity, traces are offset and black has been replaced with yellow. The outer circle presents a binary representation of the squared cumulative difference (Δ2) plot. Novel polymorphisms are labeled with the mtDNA nucleotide position. Data were collected in <30 min. using a microfabricated capillary array electrophoresis sequencing device.