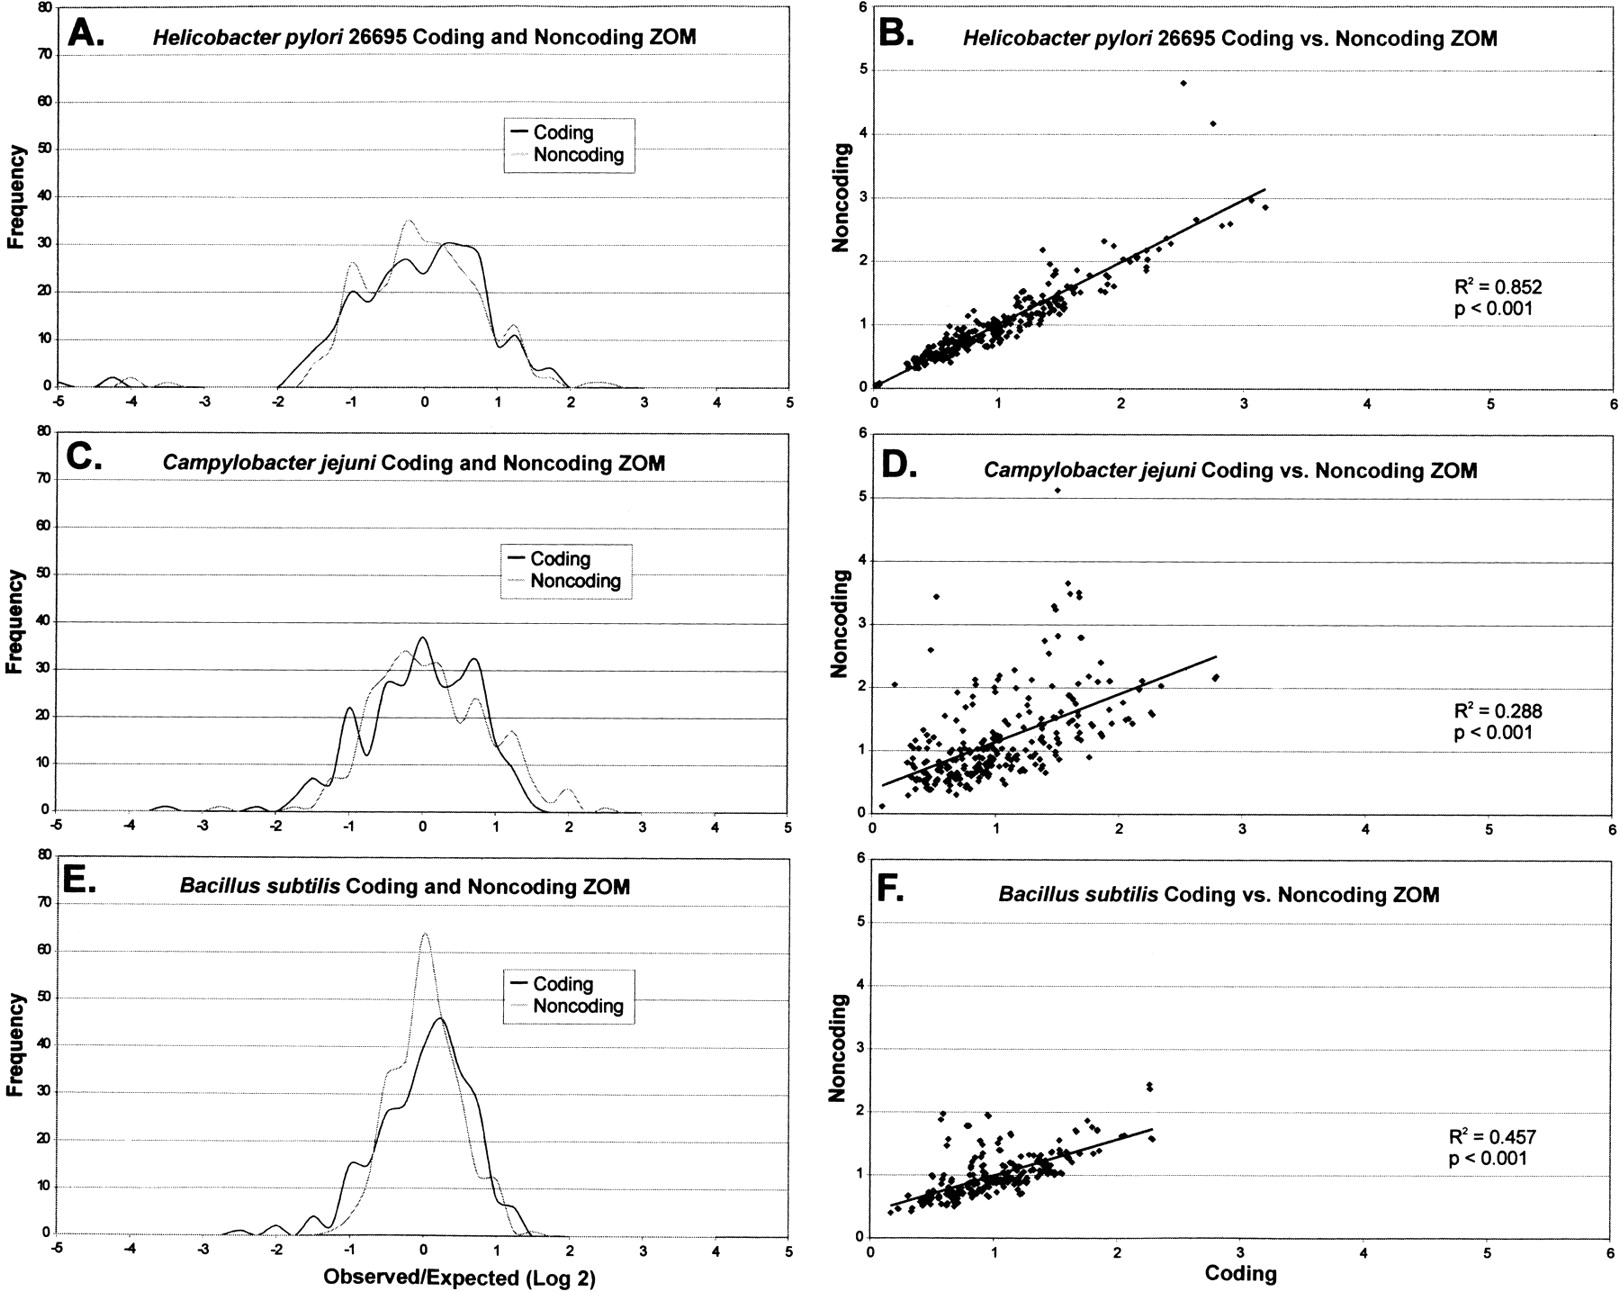
Figure 3.
Frequency distribution (A, C, E) and linear regression (B, D, F) of DNA tetranucleotide usage deviation profiles of selected prokaryotes. For each genome, the observed/expected tetranucleotide usage deviation (F(W)) was determined for the 256 combinations using zero-order Markov (ZOM) analysis as described in Methods section. The F(W) values were sorted within 0.25 intervals and the ordinate represents the number of tetranucleotide combinations within each interval.