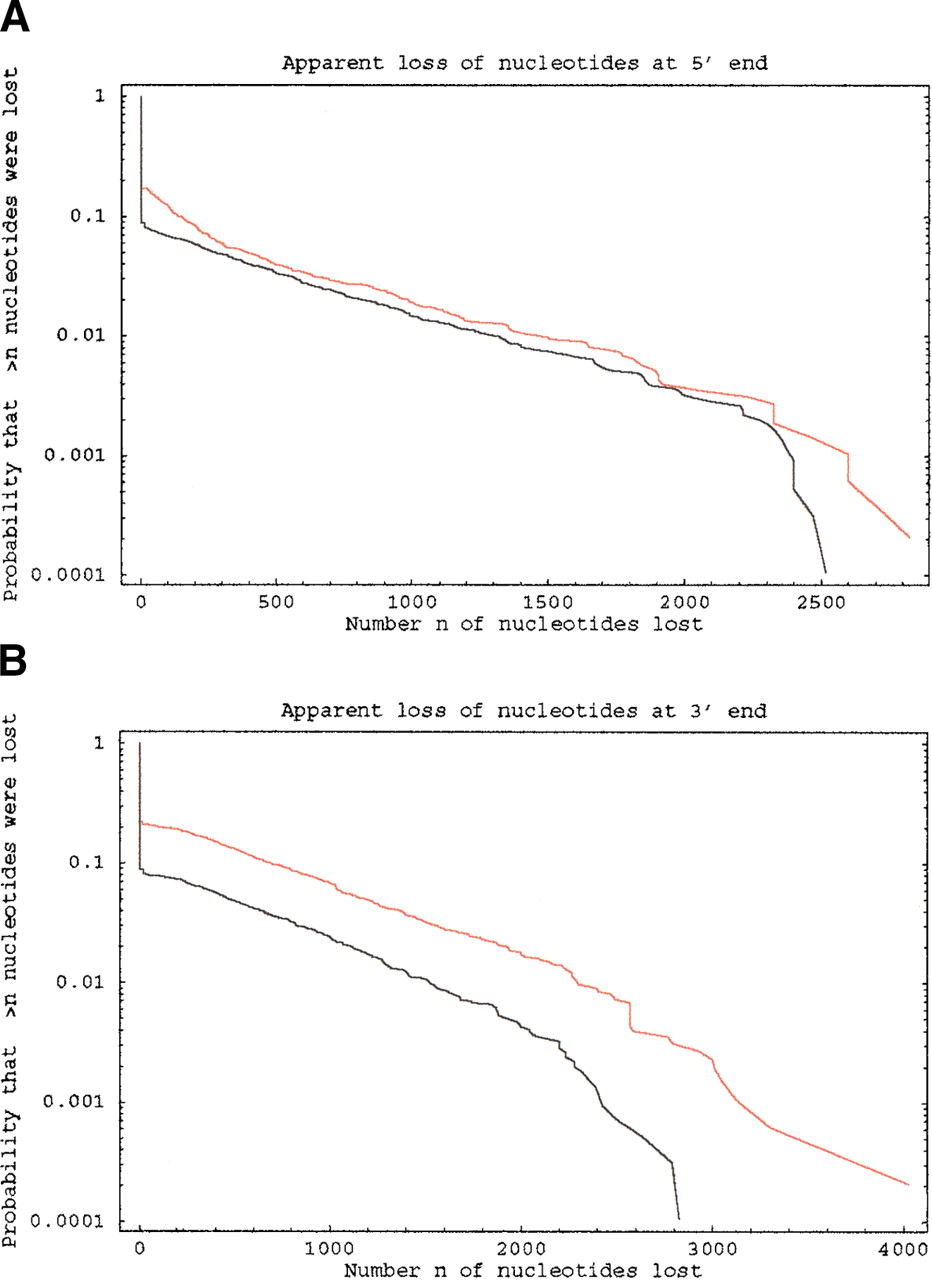
Figure 3.
Distribution of the apparent base loss (nucleotides) at the 5′ (A) and 3′ (B) end of the clones in clusters with (red) and without (black) splice variation.
Distribution of the apparent base loss (nucleotides) at the 5′ (A) and 3′ (B) end of the clones in clusters with (red) and without (black) splice variation.