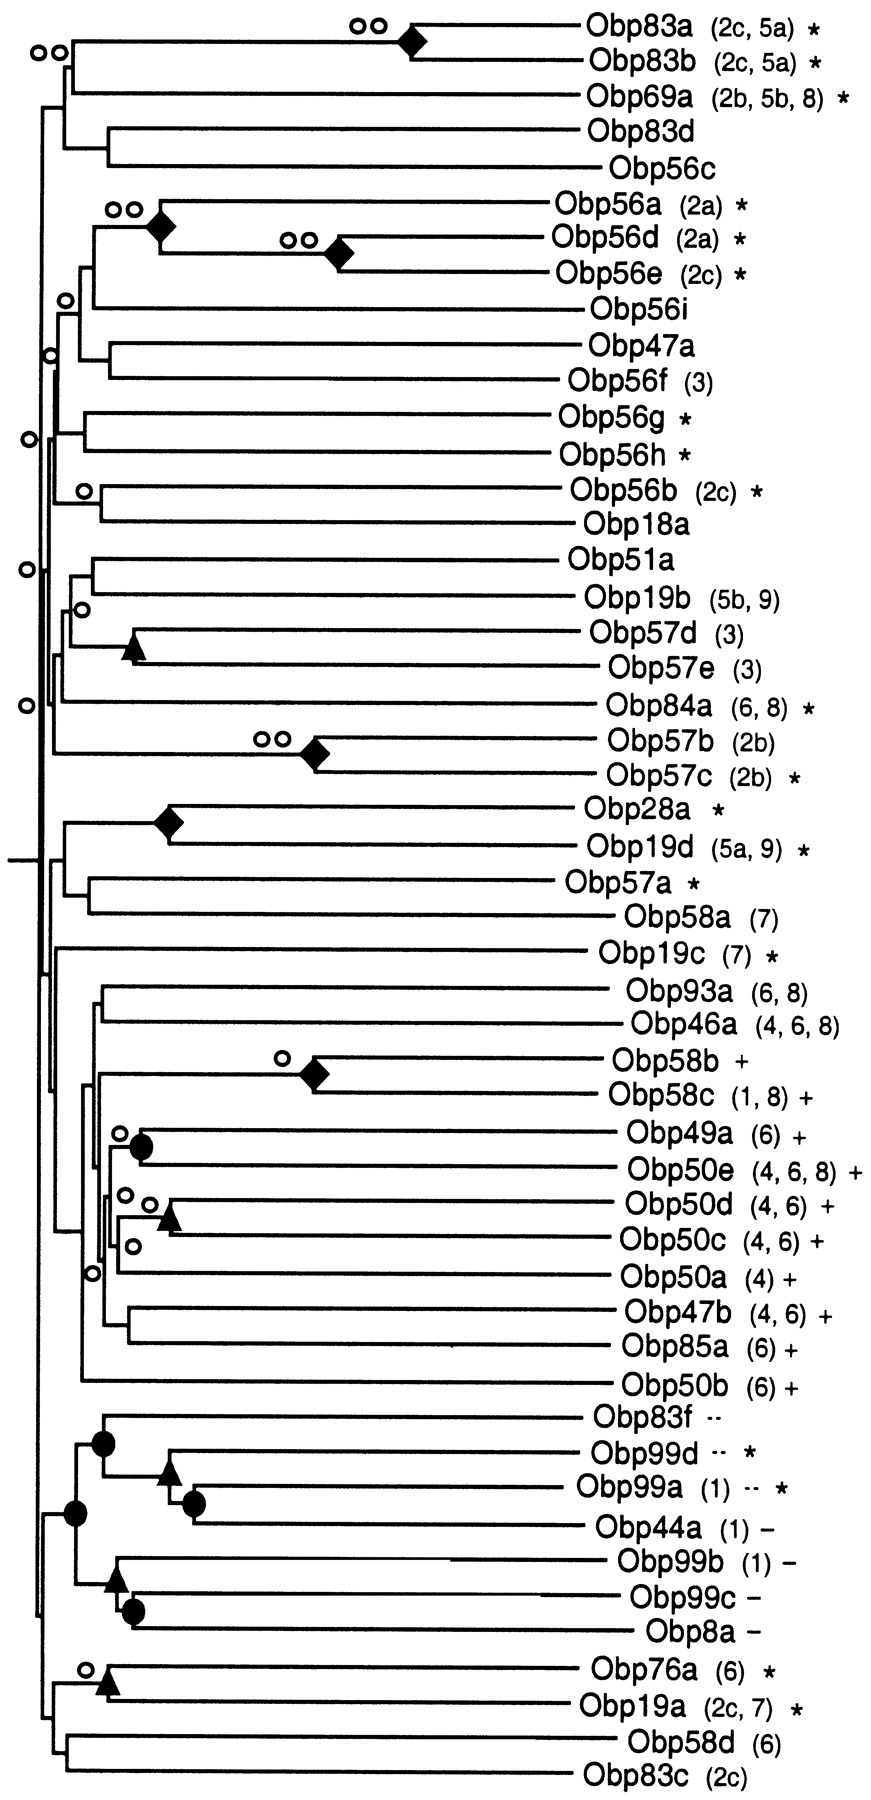
Phylogenetic comparison of Drosophila OBP family members. Depicted is an unrooted distance (neighbor-joining) tree that represents the relatedness of the various Drosophila OBP family members. The tree was constructed using an alignment ofDrosophila OBPs that was identical to the one shown in Figure2 with the divergent signal sequence-bearing N terminus removed from each OBP sequence. Each truncated protein starts at the same relative position at the beginning of helix α1a (i.e., ENY for Obp83a; cf. Fig. 2). Conserved intron insertion sites in the corresponding genes (cf. Fig. 2) are given in parentheses. Branch lengths are proportional and reflect the mean distance (percentage difference) between the various sequences. Symbols indicate nodes whose bootstrap values are at least 90% (♦), 70% (▴), or 50% (●). Nodes whose meandn/ds ratios are <0.25 are indicated by two open circles (○○) and those between 0.5 and 0.25 by a single open circle (○). Plus-C OBPs (+) and Minus-C OBPs lacking C2 and C5 (−) or carrying all six conserved cysteines (…) are identified. Each OBP for which olfactory system expression has been shown (cf. Table 1) is indicated by an asterisk.