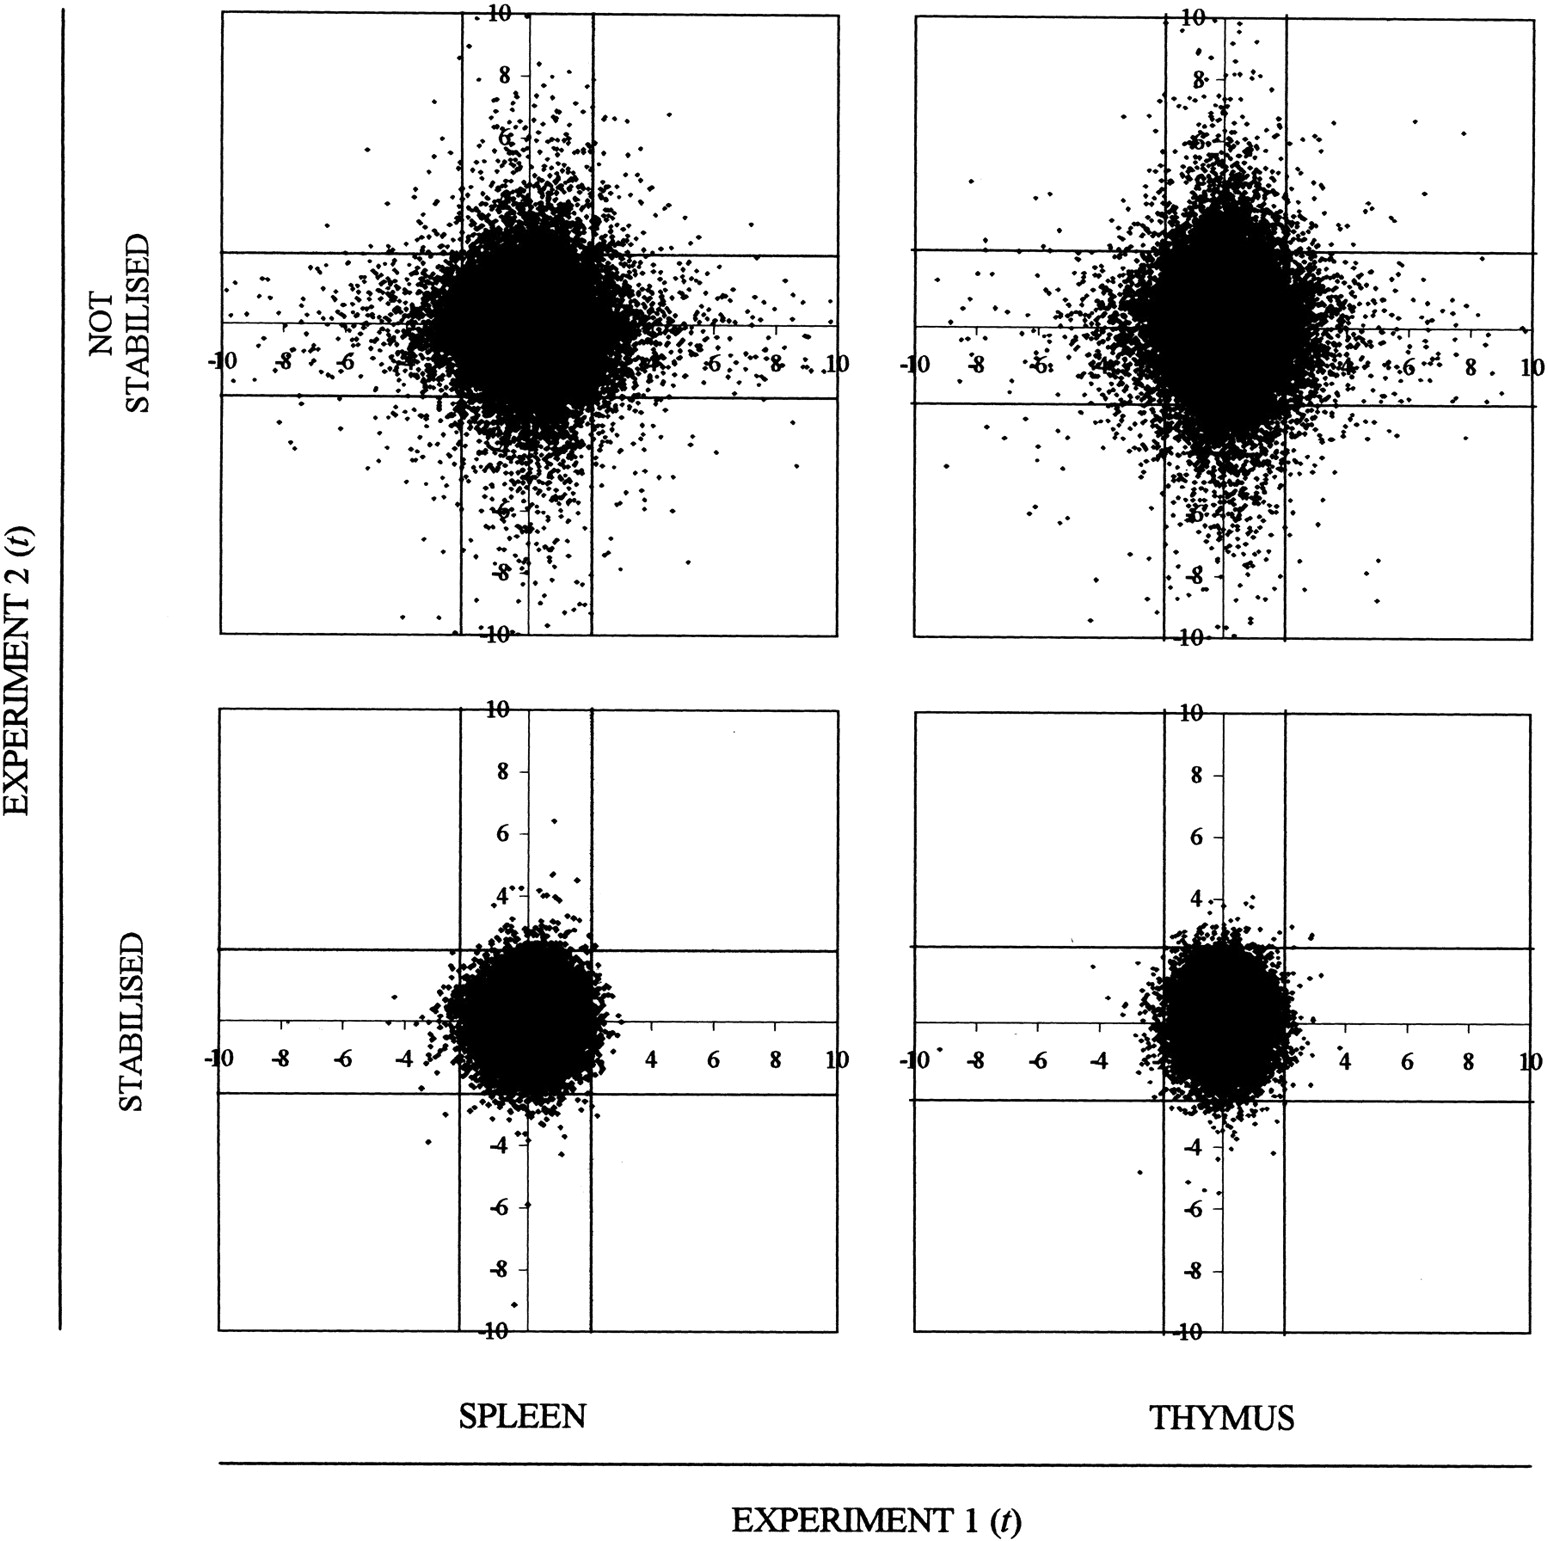
Joint distribution of t across the two independent replicate experiments for a comparison between NOD-derived strains carrying theIdd3 resistance allele (Idd3 and Idd3/5) and those carrying the susceptible allele (NOD, Idd5, andIdd9). (Top and bottom) Distributions before and after incorporation of the local variance estimates. Positive and negative values of t indicate stronger and weaker mean hybridization signals in the Idd3–Idd3/5 group compared with the control group, respectively. The vertical and horizontal lines are set such that only 1 gene of the ∼20,000 deemed to be expressed would be expected to fall in either the upper right or lower left quadrangles of the stabilized plots by chance. Eight probe sets met these criteria and were deemed to show suggestive evidence for a difference in expression level.