Figure 3.
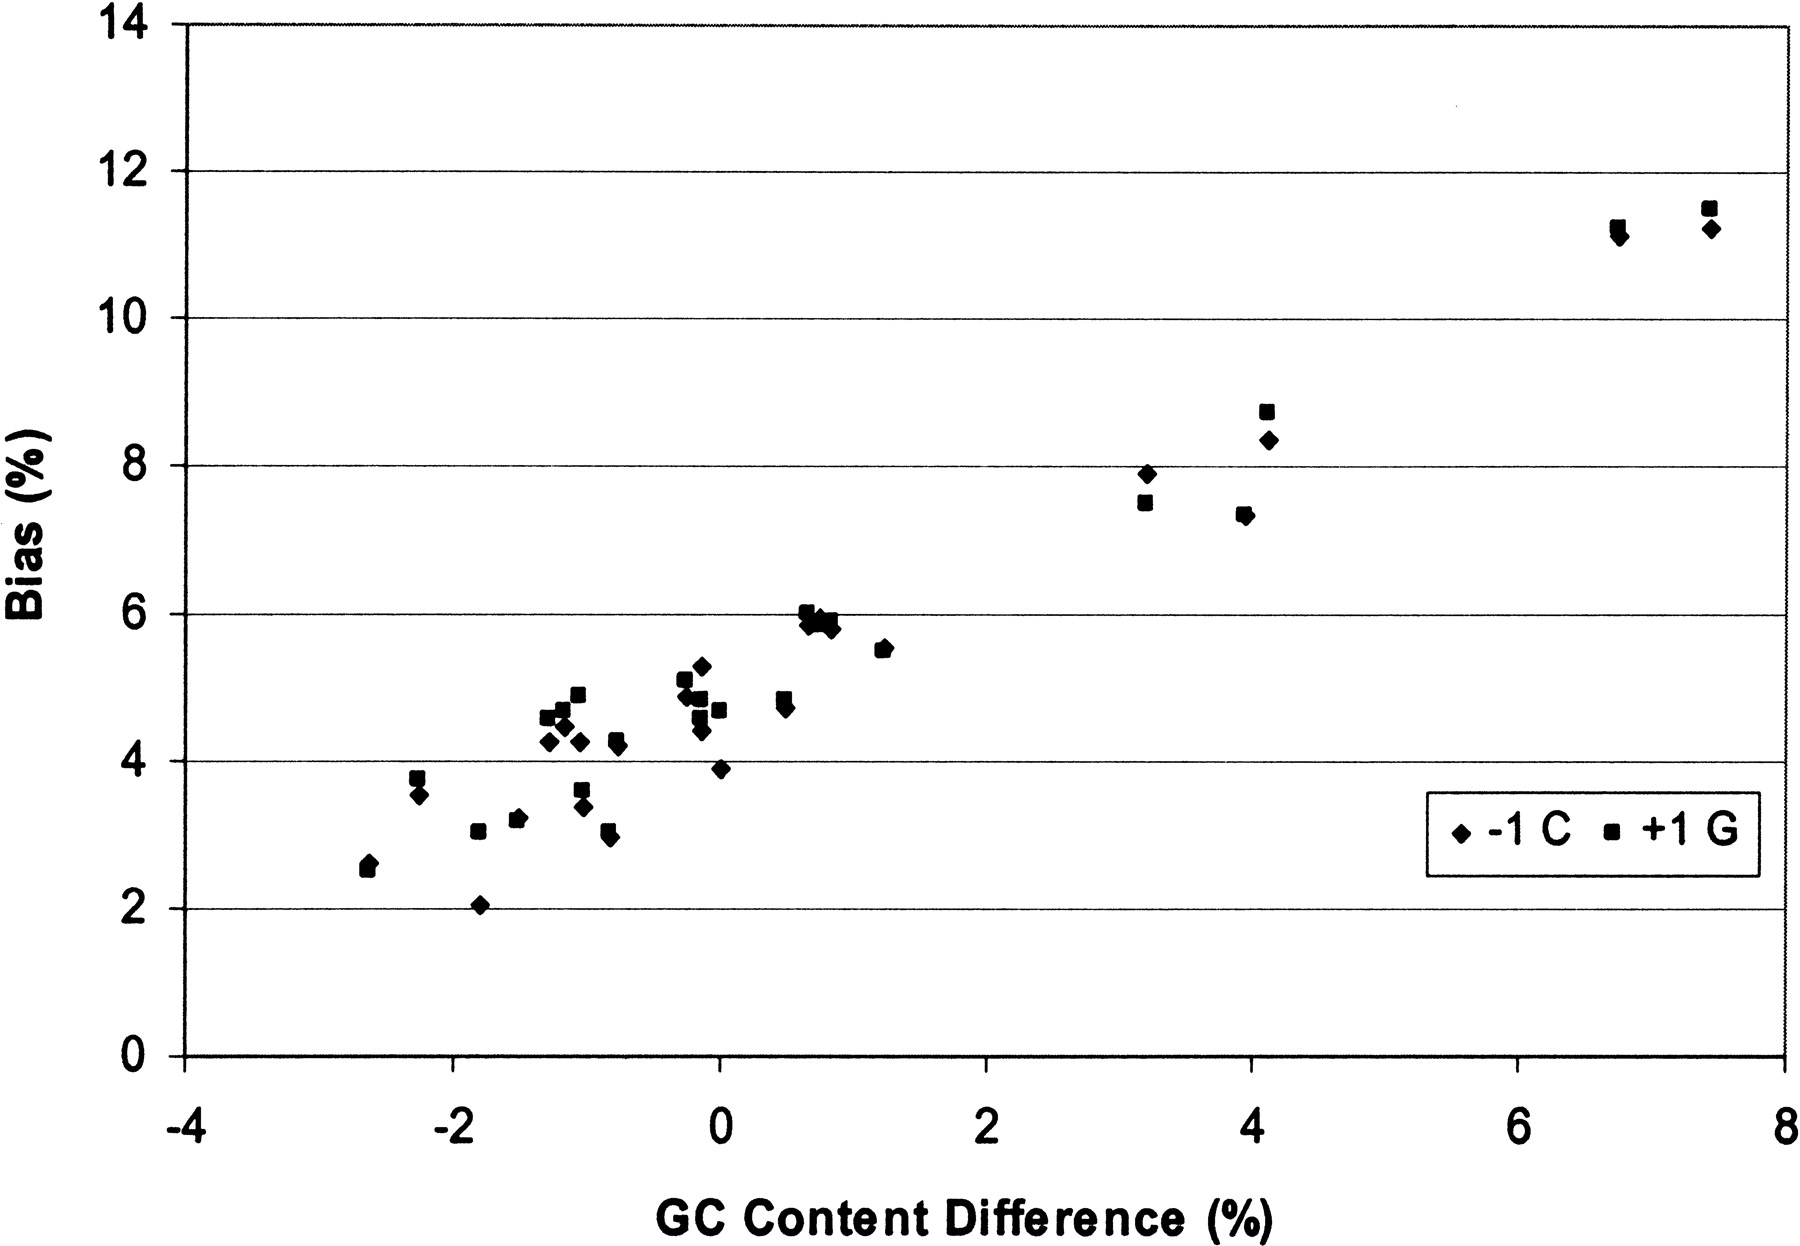
Linear correlation between the GC content difference from the genome average and the proportion of bias at −1 C and +1 G observed on each chromosome.
Linear correlation between the GC content difference from the genome average and the proportion of bias at −1 C and +1 G observed on each chromosome.