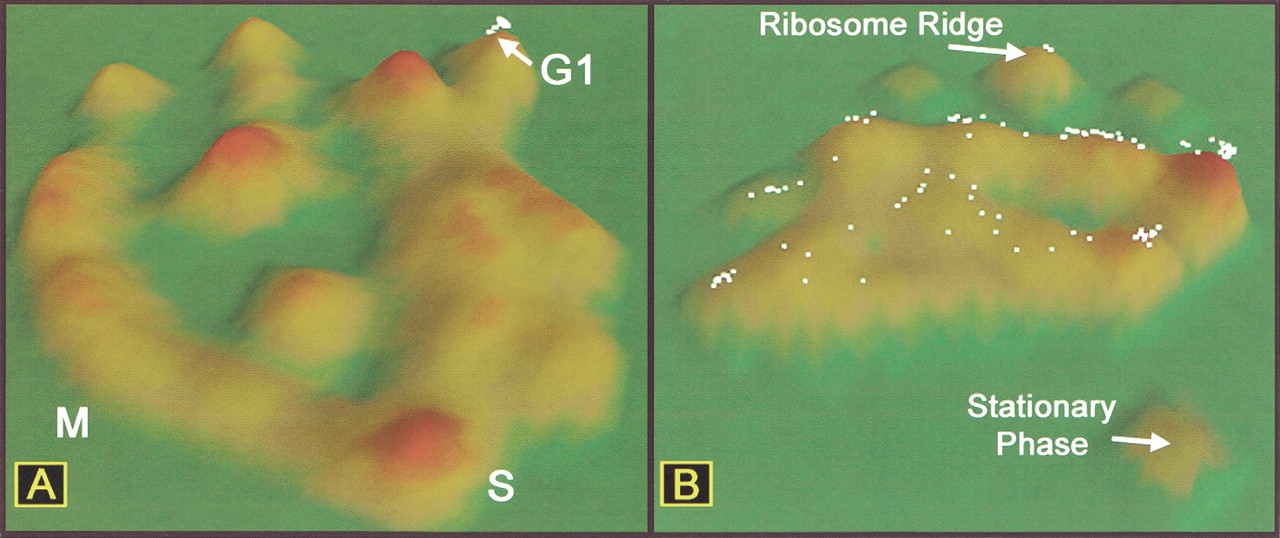
Figure 3.
Location of G1-regulated genes in two different gene-expression data sets. (A) Dots represent selected G1-regulated genes in α-factor–arrest cell-cycle data (Spellman et al. 1998). (B) Location of the same genes in the ordination of stationary-phase exit data.