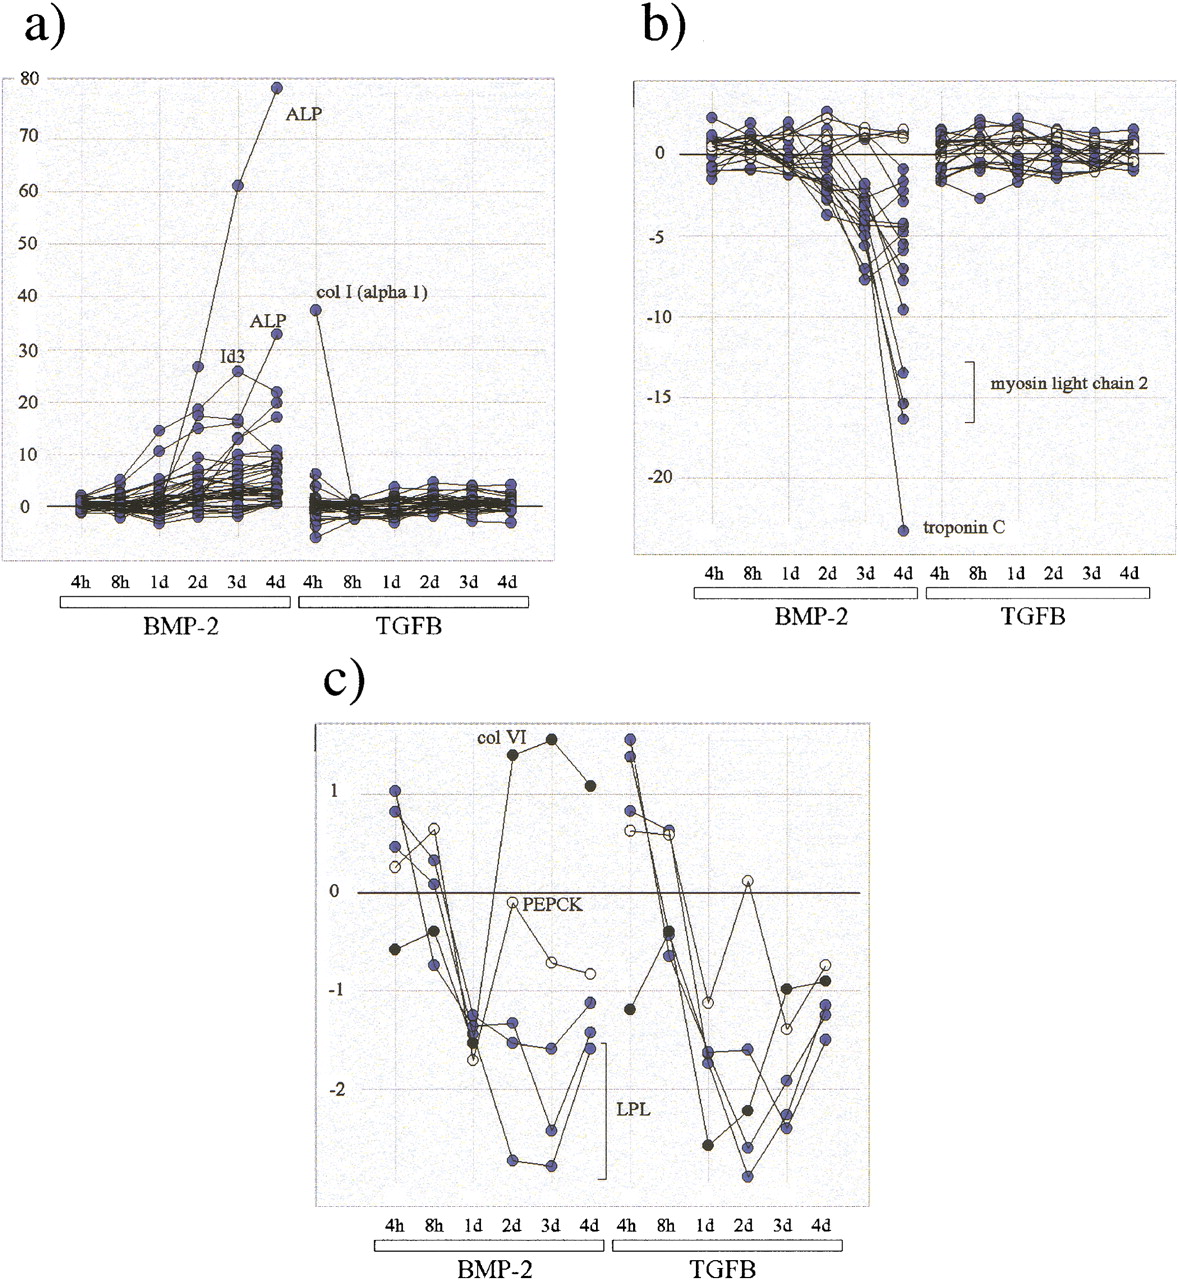
Figure 3.
Comparison of expression profiles for the Bone, Muscle, and Adipocyte training set qualifiers present in the C2C12 reduced data set (N χ2 = 2500). (a) Superposition of profiles for the 44 Bone markers (15 distinct genes); (ALP) alkaline phosphatase; [col I (α 1)] type I collagen chain. (b) superposition of profiles for the 20 Muscle markers (nine genes). (○) γ Actin. (c) Superposition of profiles for the five Adipocyte markers (three genes); (col VI) type VI collagen; (PEPCK) phosphoenolpyruvate carboxykinase; (LPL) lipoprotein lipase. All expression ratios have been transformed according to the Sym(R) function (see text and equation 4, Methods).