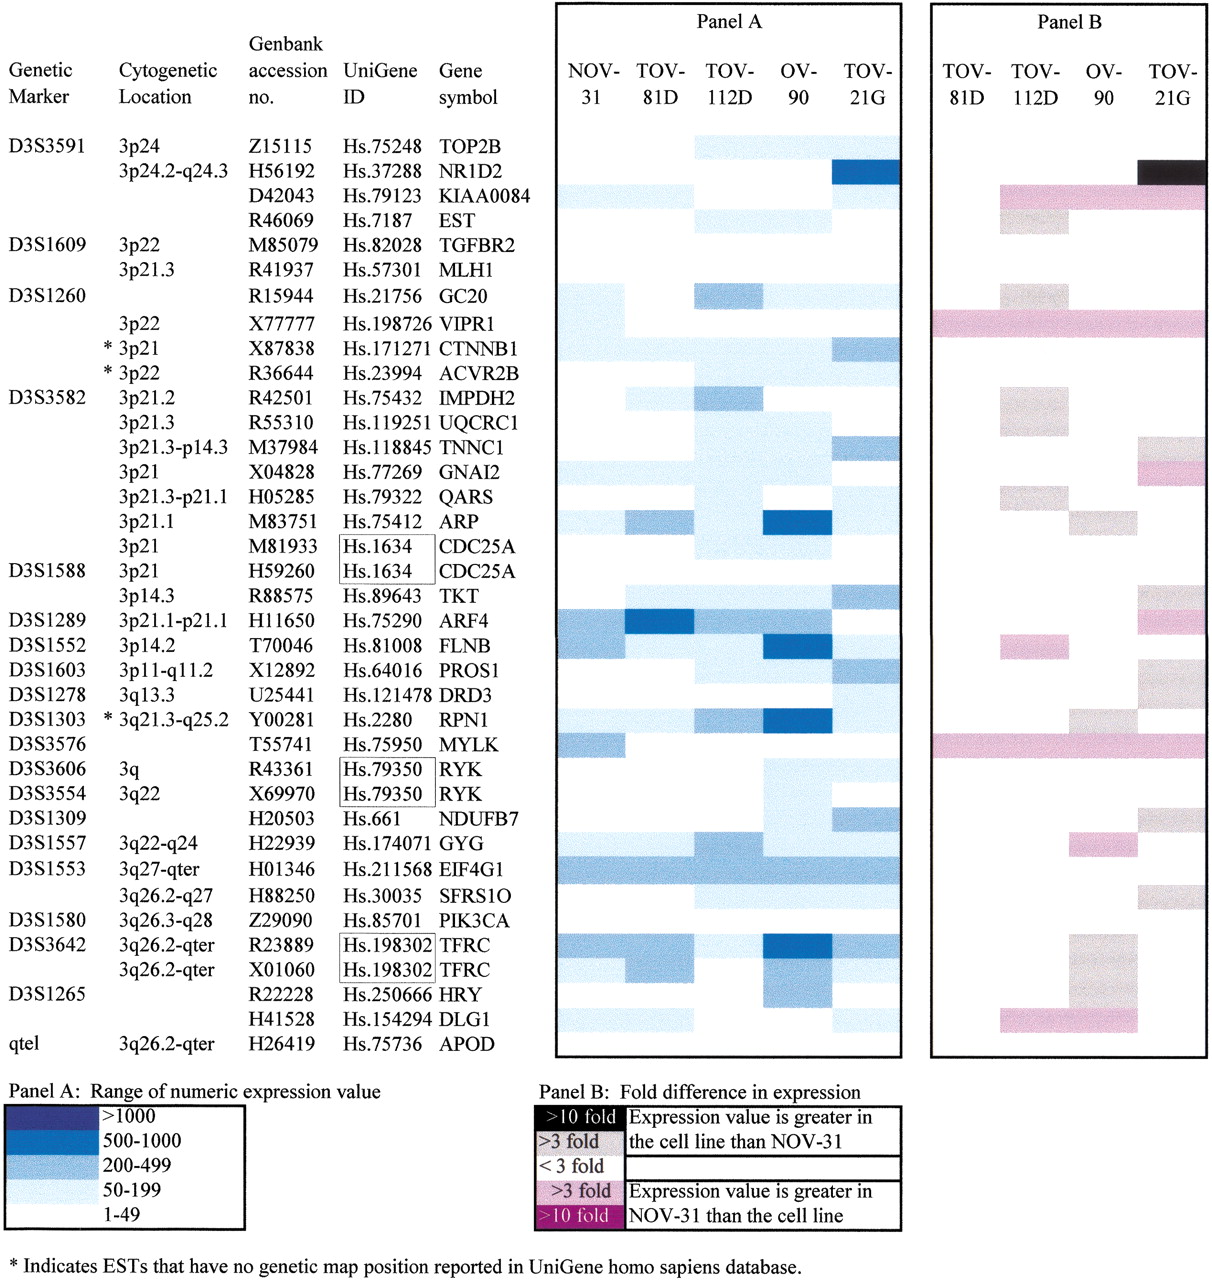
Figure 3.
A schematic representation of selected ESTs that are differentially expressed on the basis of their range of numeric expression value (Panel A) or at least a threefold difference in expression between NOV-31 and any EOC cell line (Panel B). The ESTs are displayed from the 3p telomere to the 3q telomere in order of genetic and cytogenetic map position on the basis of information retrieved from the UniGene-Homo sapiens database, NCBI. A box around two ESTs indicates that they represent the same gene. The figure that displays the expression profiles for all 290 ESTs is available athttp://genome.mcgill.ca/ovarian.