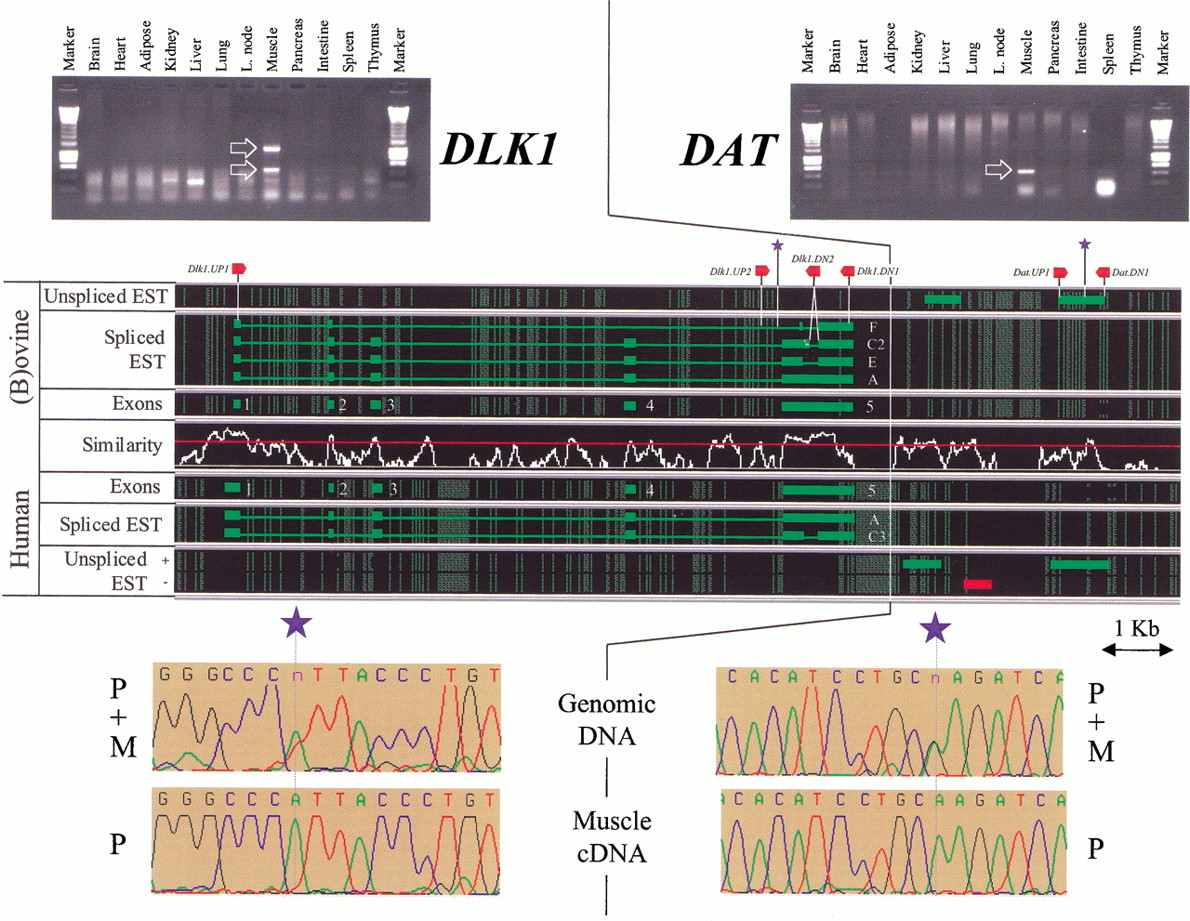
Organization, expression profile, and imprinting of DLK1 andDAT. Spliced and unspliced ESTs whose transcriptional orientation could be inferred [(green) transcribed from the + strand; (red) transcribed from the − strand], were aligned with respect to the moving average similarity profile obtained for the human–ovine framework alignment (see Fig. 2). (Thick lines) EST matches; (thin lines) predicted introns. (Red arrows) The approximate positions of the primers used for genomic PCR, RT-PCR, and cycle sequencing; (blue asterisks) the approximate position of the SNPs used to evaluate the imprinting status. Expression profiles deduced from the analysis—by agarose gel electrophoresis—of RT-PCR products obtained with RNA from a range of tissues are shown, with specific amplification products marked by white arrows. Imprinting is demonstrated by comparison of the sequence traces obtained by cycle-sequencing equivalent amplification products obtained by genomic PCR versus RT-PCR. The parental origin of the alleles are labeled P (paternal) and M (maternal).