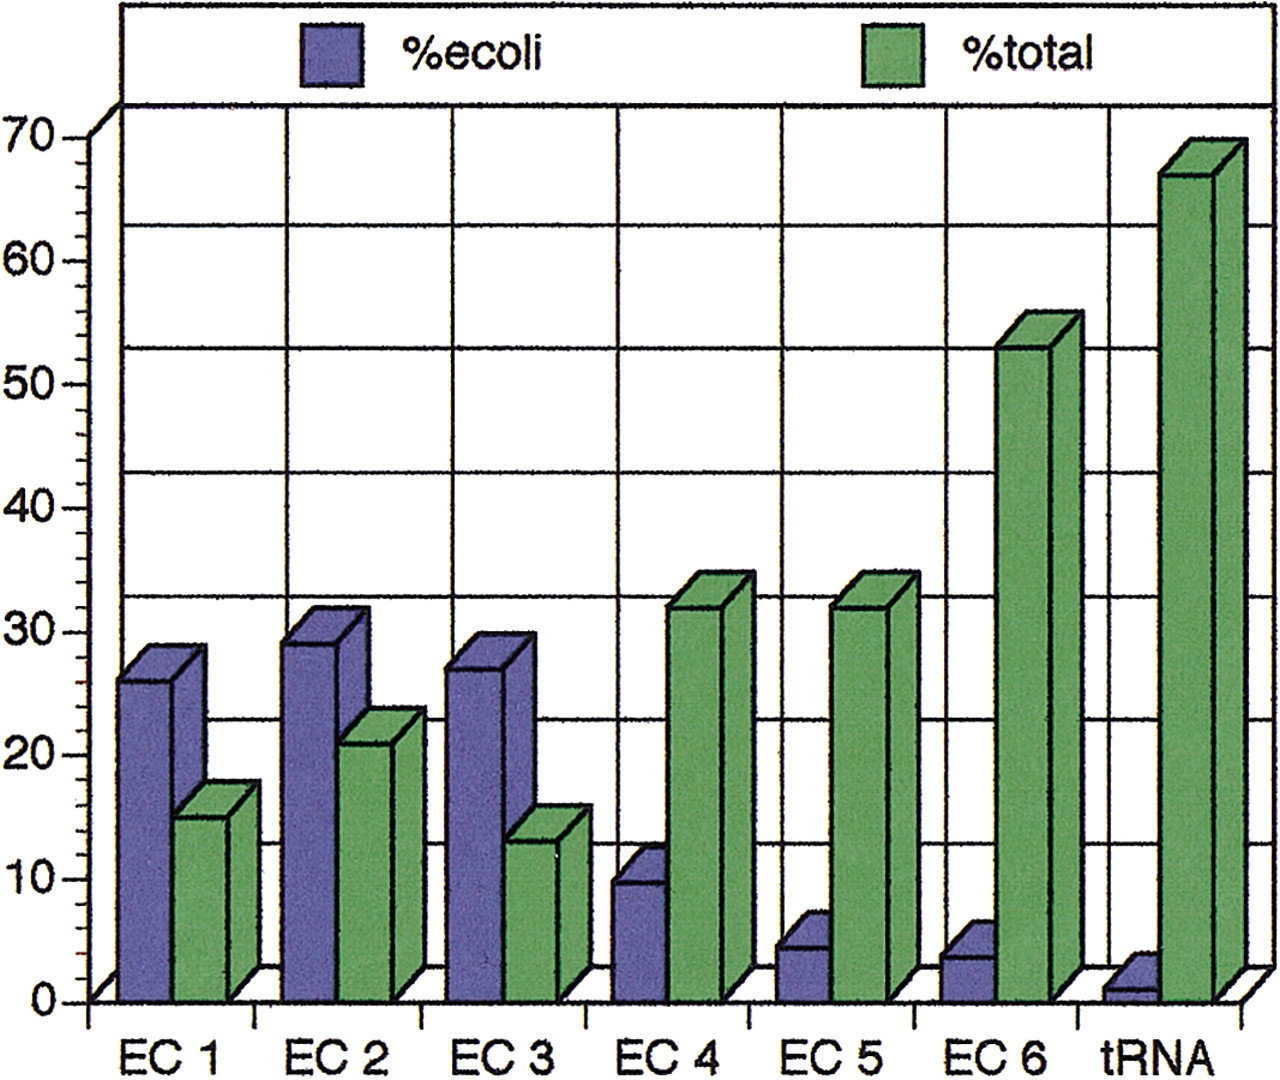
Figure 3.
The number of EC class reactions present in E. coli against the total number of EC reaction types. The blue bars (%ecoli) signify the percent contribution of each class for all known reactions in E. coli (the seven classes total 100%); the green bars (%total) signify the percent coverage of the EC classes in the known reactions in EcoCyc. Due to the apparently finer classification of classes 1–3, the two measures display an inverse relationship: More reactions in E. coli belong to classes 1–3, although they represent a smaller percentage of reactions listed in the EC hierarchy (and vice versa).