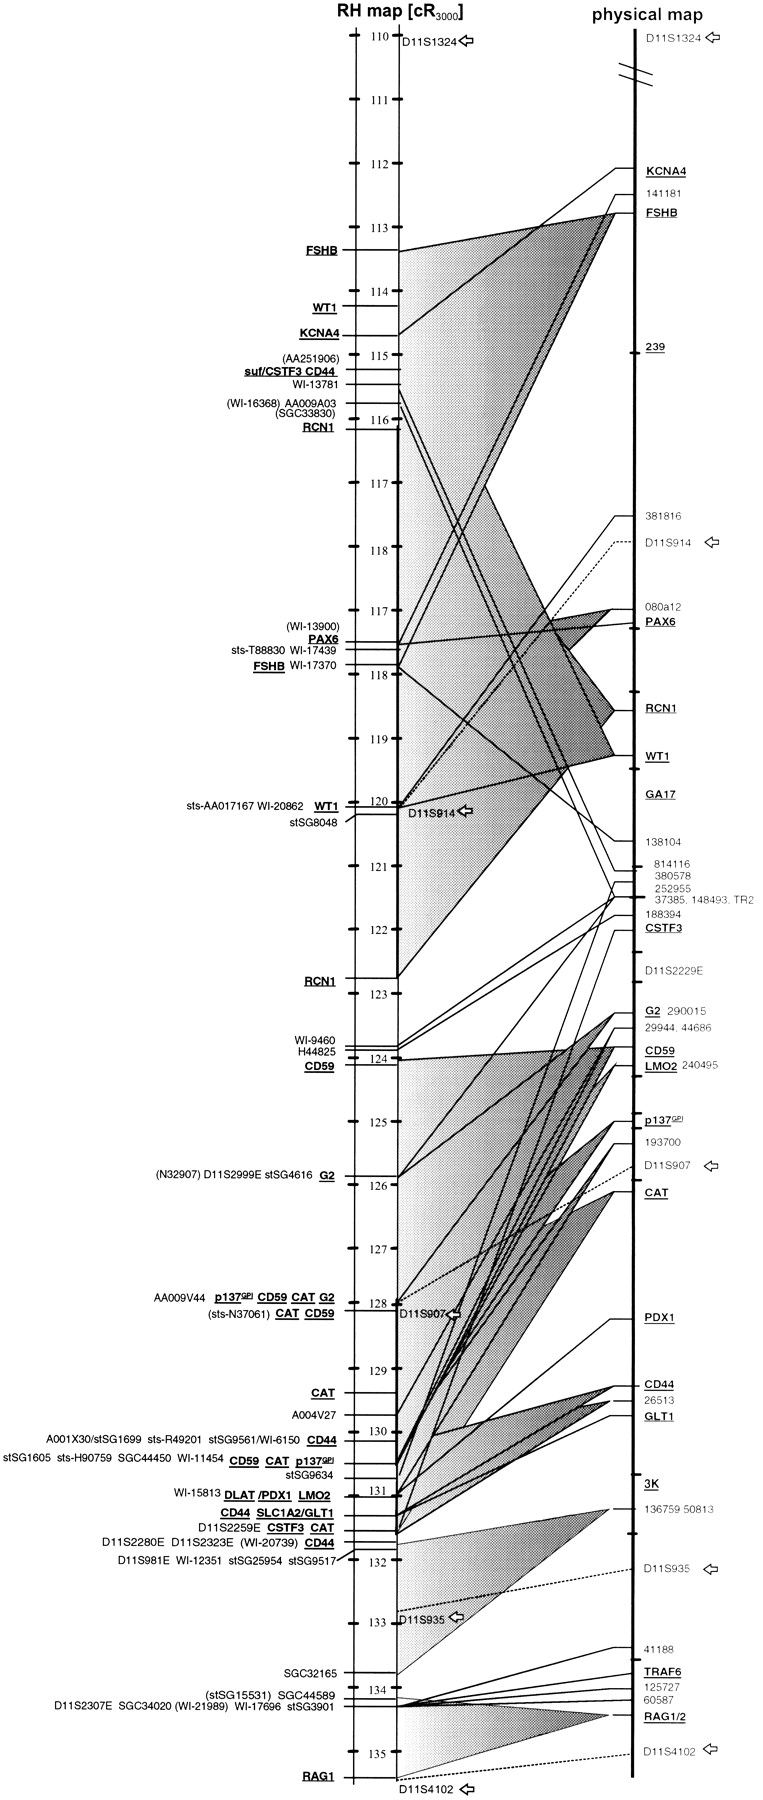
Figure 2.
Comparison of GeneMap'98 (left) and PAC contig mapping data (right). Corresponding loci are connected by lines. GeneMap'98 entries that could not be mapped to our PAC contig are enclosed by brackets; gene names are underlined. Dotted lines and arrows mark RH framework markers. Shaded triangles describe the positional variation of genes or markers resulting from the use of multiple STSs (compare Table 2).