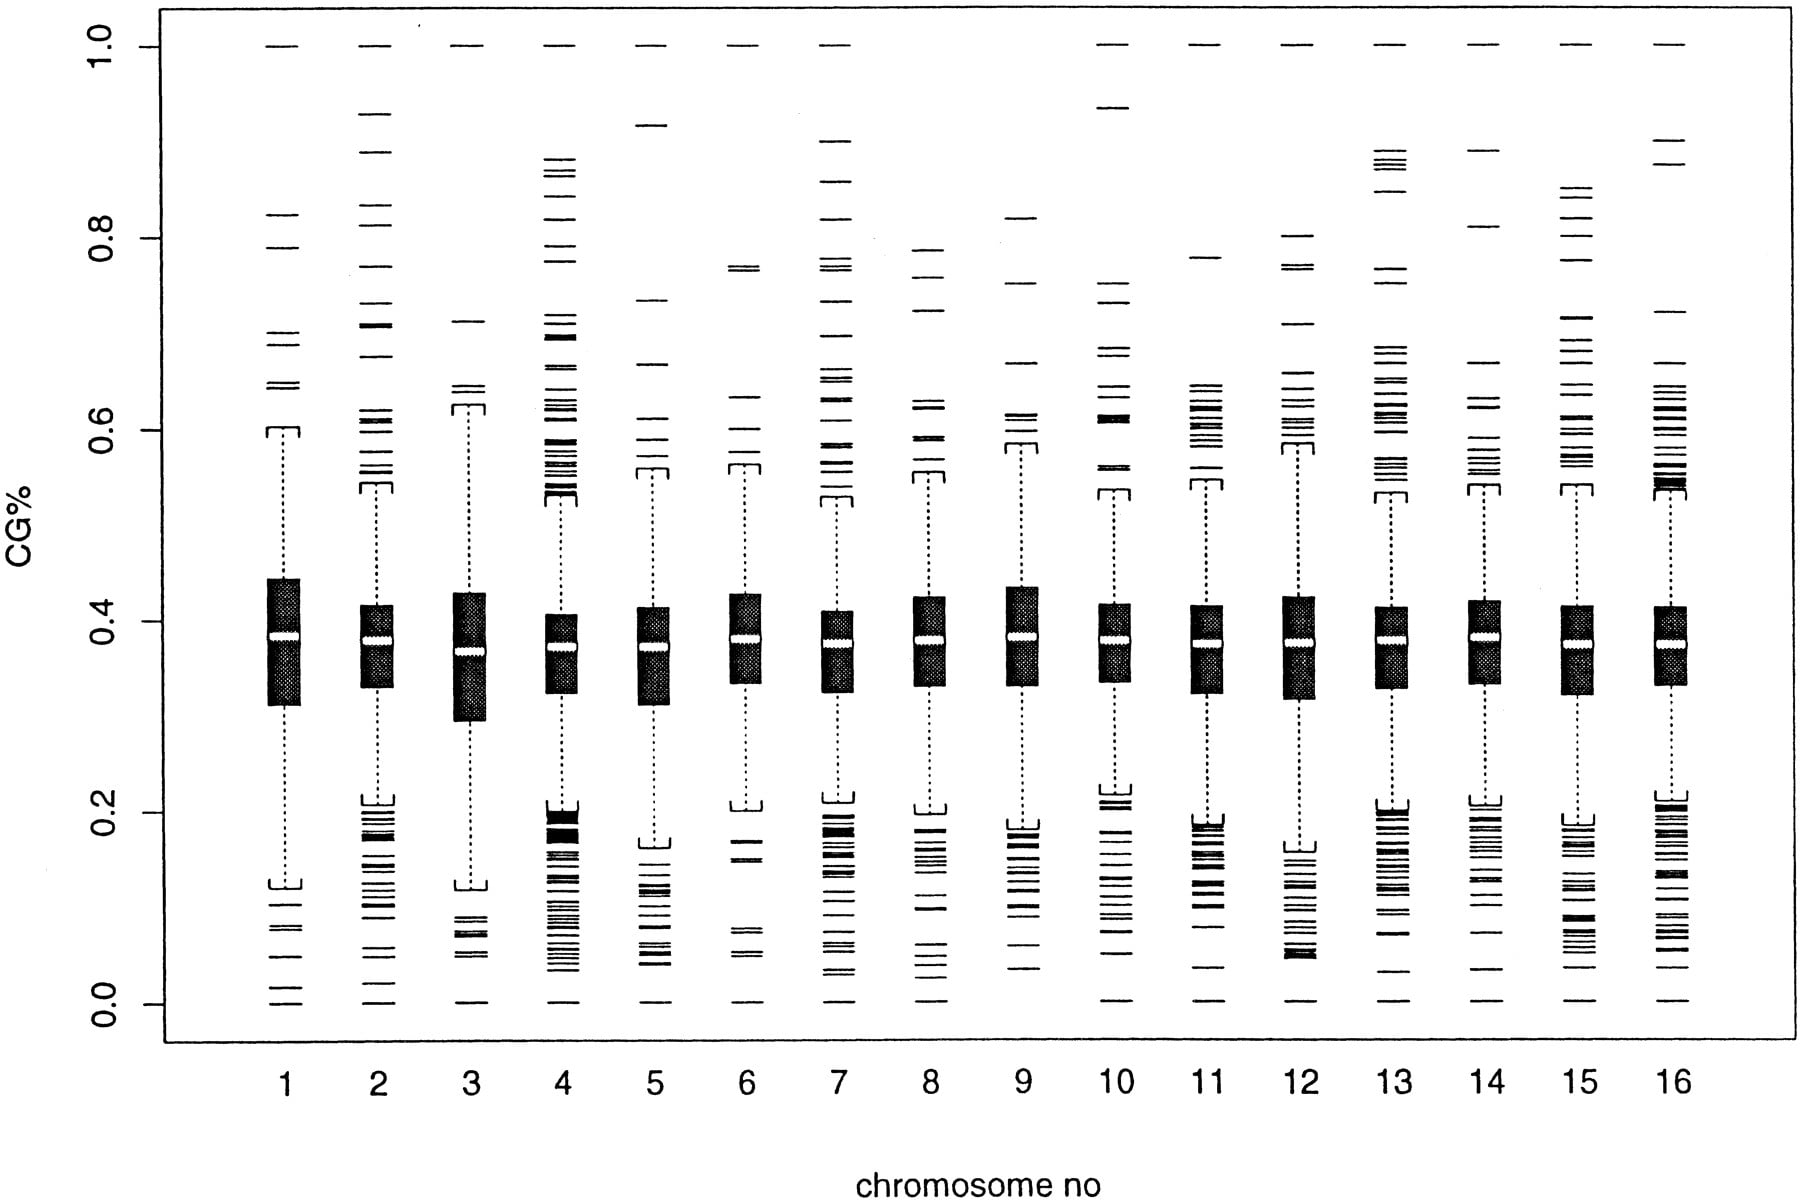
Figure 2.
Box plot of C + G% in all 16 chromosomes, expressed as a fraction of 1. A box plot contains the following information: median (the middle line), first and third quartile (box), 1.5 of the interquartile distance (whisker), and outliers (top and bottom lines). This plot is obtained using the statistical package S-PLUS v. 3.4.