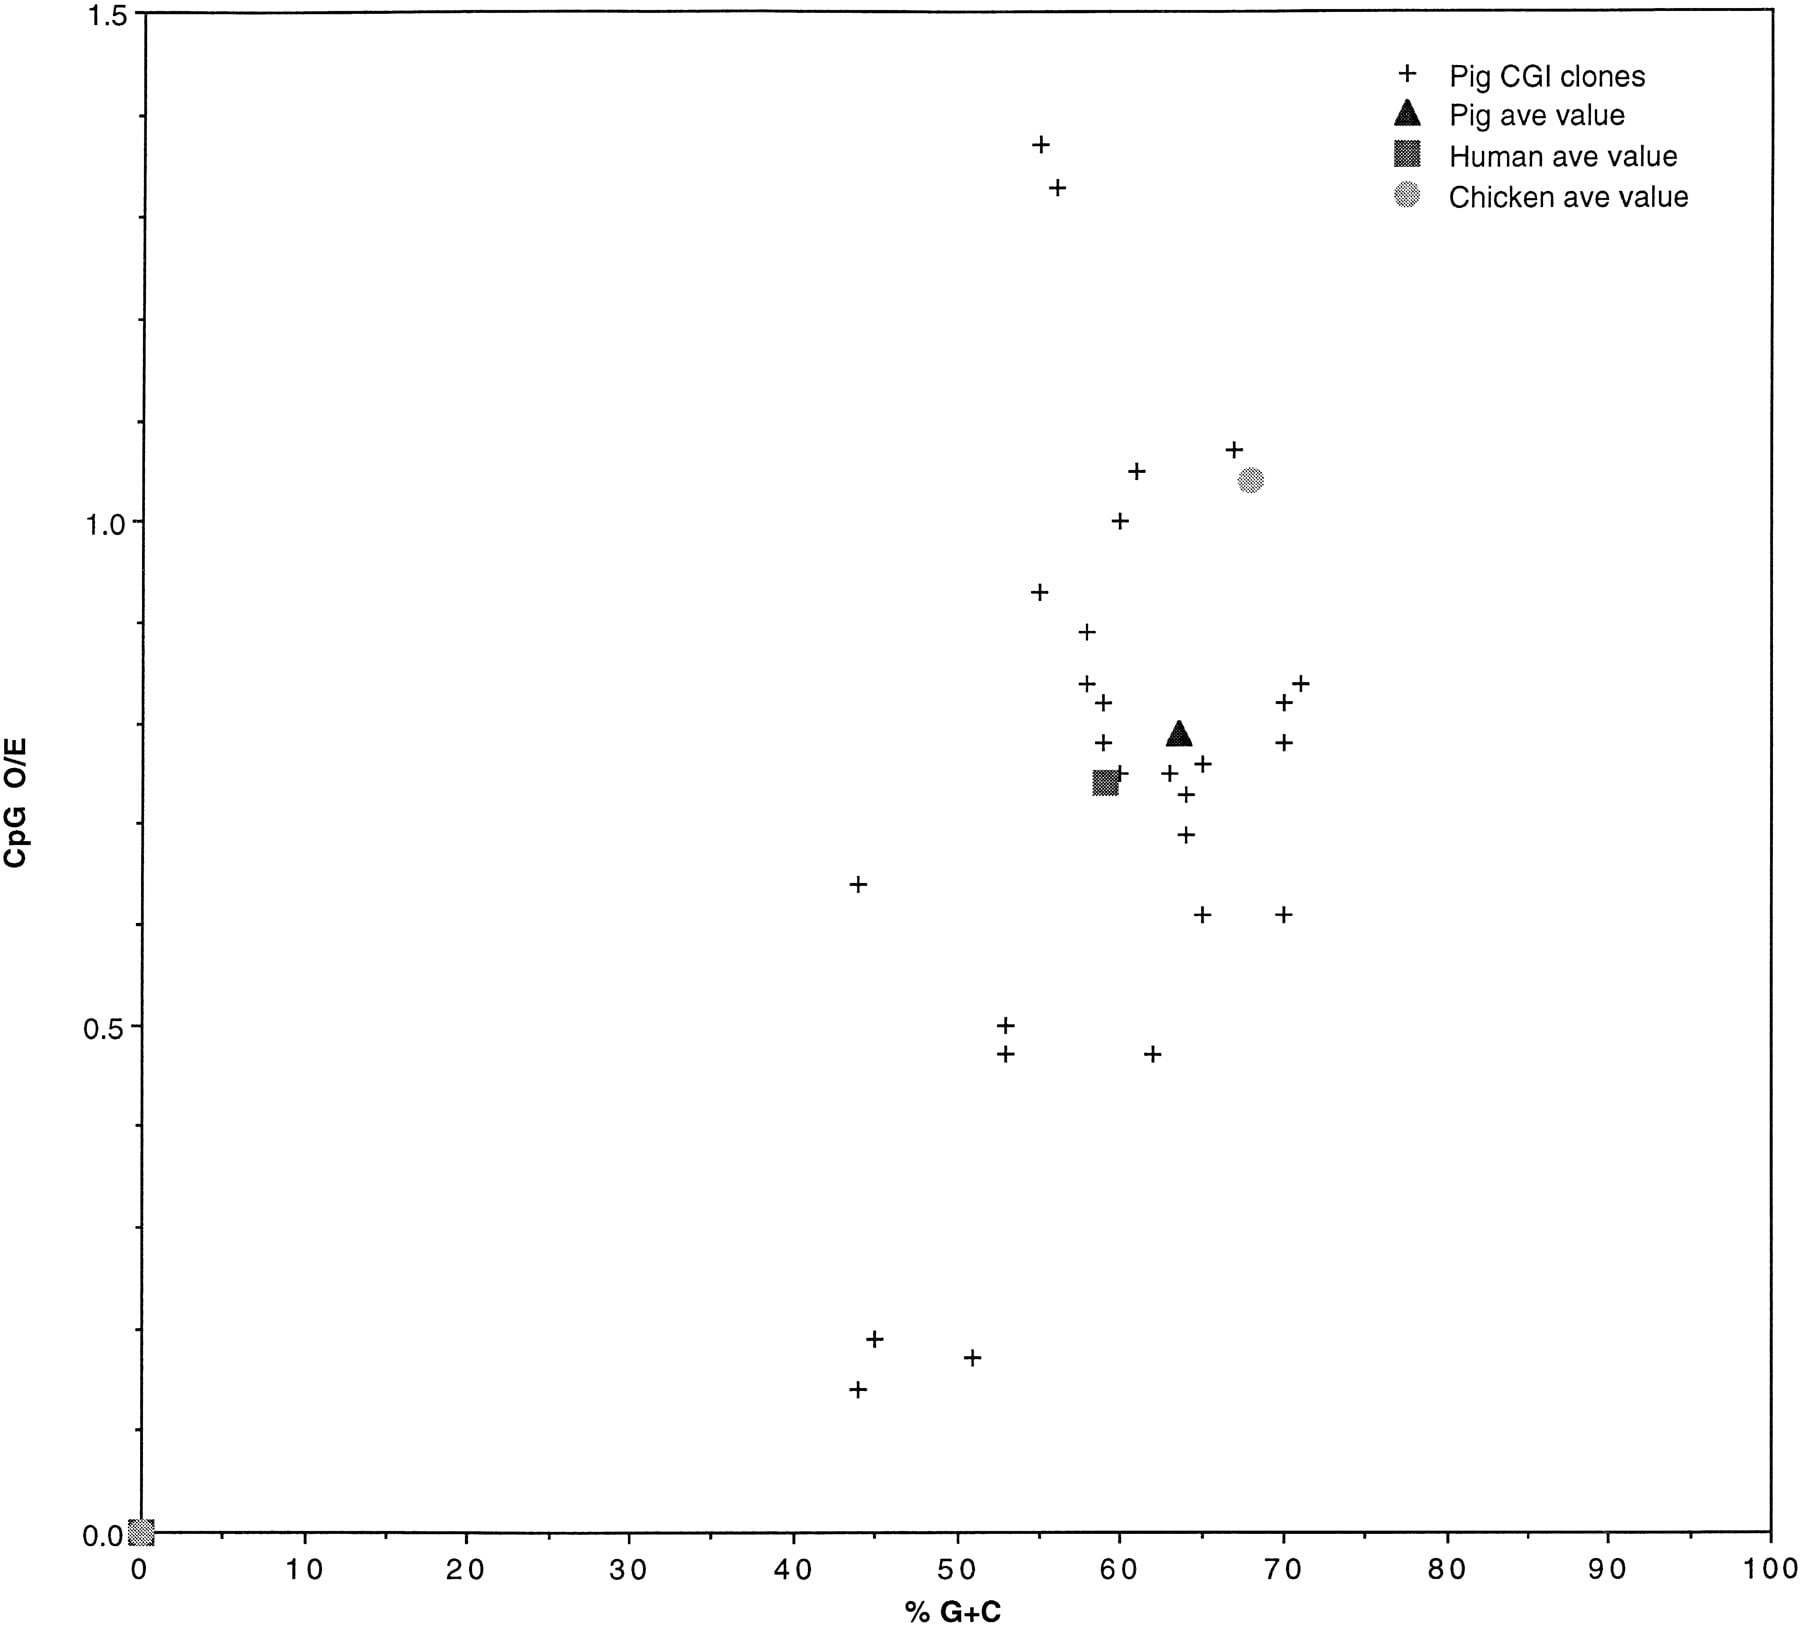
Figure 2.
A comparison of the 27 pig CGI library clones with average CGI library values for pig, human, and chicken. Clones are plotted with respect to percent G + C on the x-axis and the frequency of the dinucleotide CpG on the y-axis. The seven borderline and non-CGI pig clones (see text) are included. Average CGI library values for human and chicken are calculated from original data supplied by S. Cross and H. McQueen, respectively (pers. comm.).