Figure 2.
Parente2’s sensitivity as a function of the number of training individuals. Parente2 was run on the WTCCC-2cM data set. The vertical axis shows sensitivity at a 1% false-positive rate.
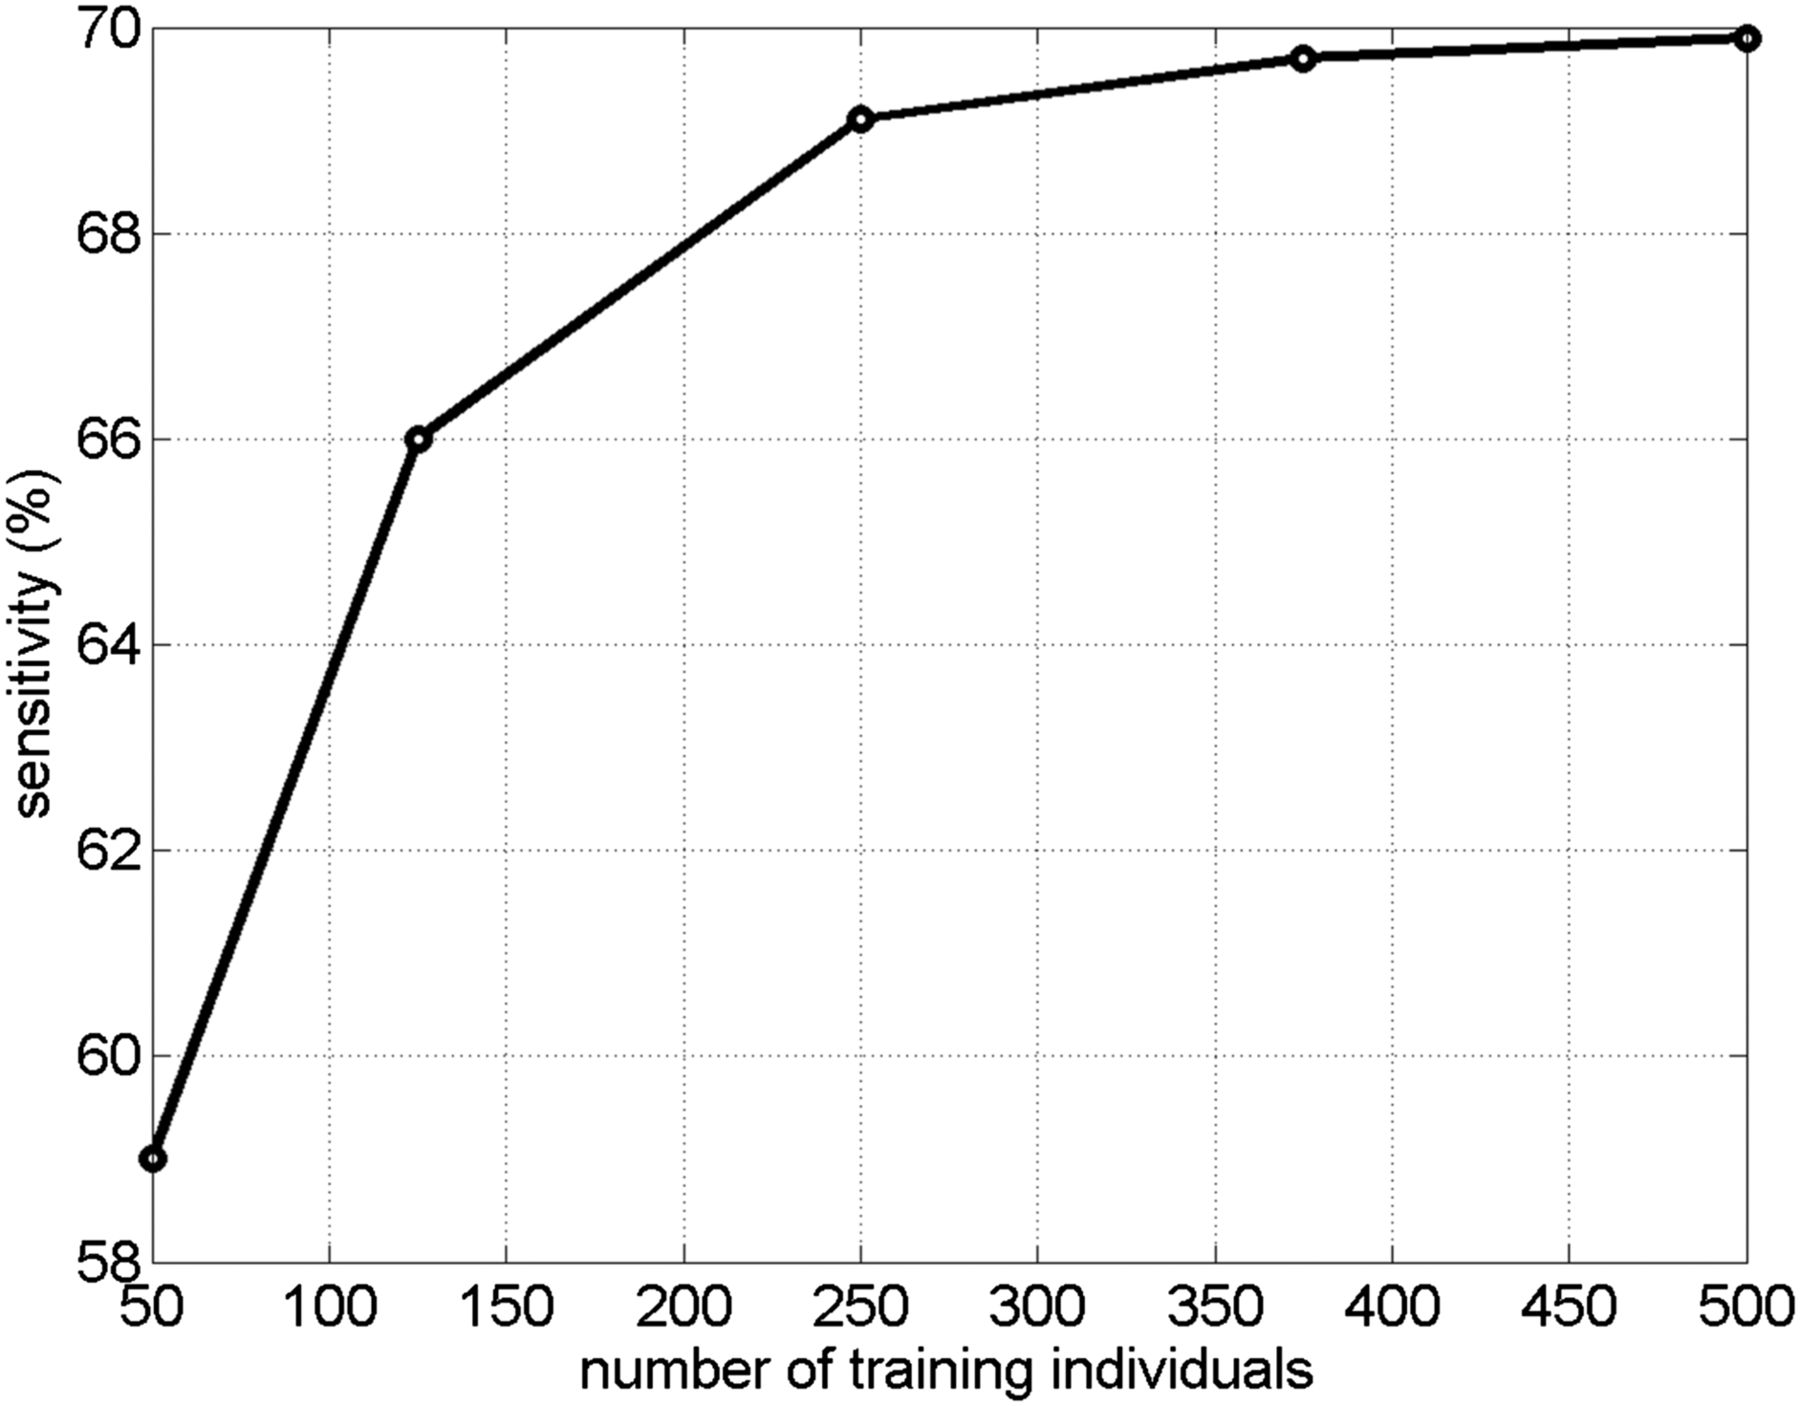
Parente2’s sensitivity as a function of the number of training individuals. Parente2 was run on the WTCCC-2cM data set. The vertical axis shows sensitivity at a 1% false-positive rate.