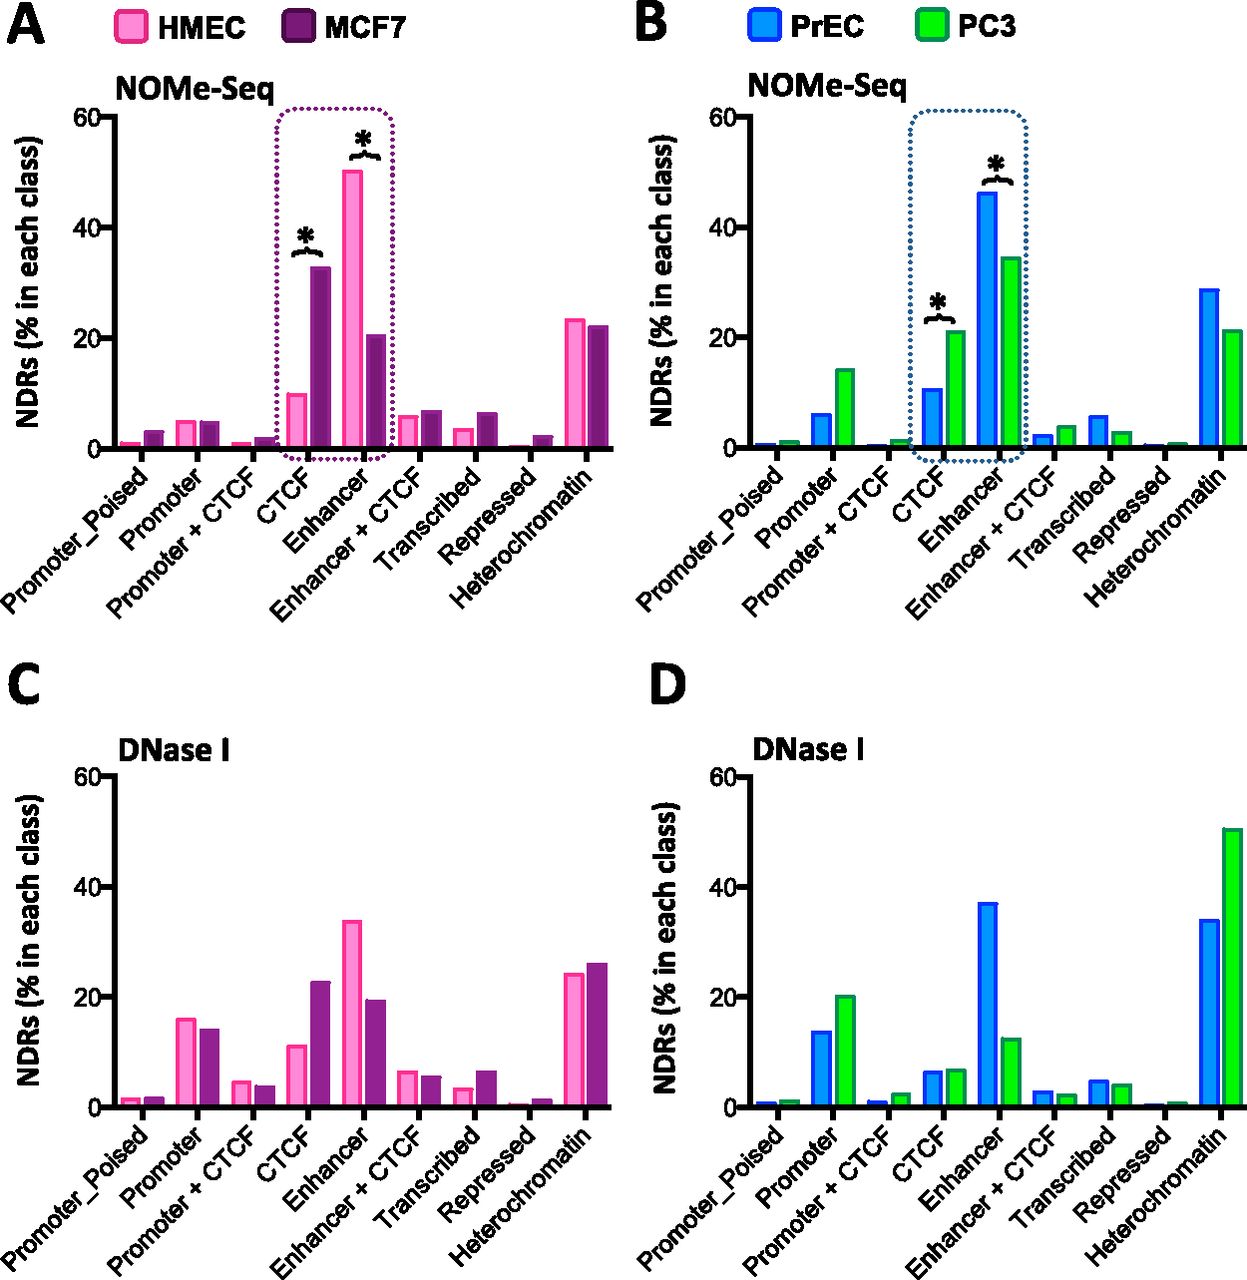
NDRs are enriched at enhancers in normal epithelial cells and change to predominantly overlap CTCF in cancer cells. (A,B) ChIP assays were performed with antibodies detecting RNA Pol II-P, H3K4me3, H3K27ac, H3K4me1, and H3K27me3 on chromatin from HMEC, MCF7, PrEC, and PC3 cells. ChIP-seq data for CTCF was generated (PC3) or obtained from ENCODE. ChIP-seq chromatin states were classified using the ChromHMM hidden Markov model (Ernst and Kellis 2012). Data are presented as percentage of NDRs detected by NOMe-seq in each of nine chromatin states (heterochromatin, repressed, transcribed, enhancer, enhancer + CTCF, CTCF, promoter + CTCF, promoter, promoter_poised) (y-axis) for HMEC (pink bars), MCF7 (purple bars), PrEC (blue bars), and PC3 (green bars). (C,D) As for A and B using DNase I hypersensitivity data as the measure of accessibility (percentage of NDRs in each class).