Skip to main content
Figure 2.
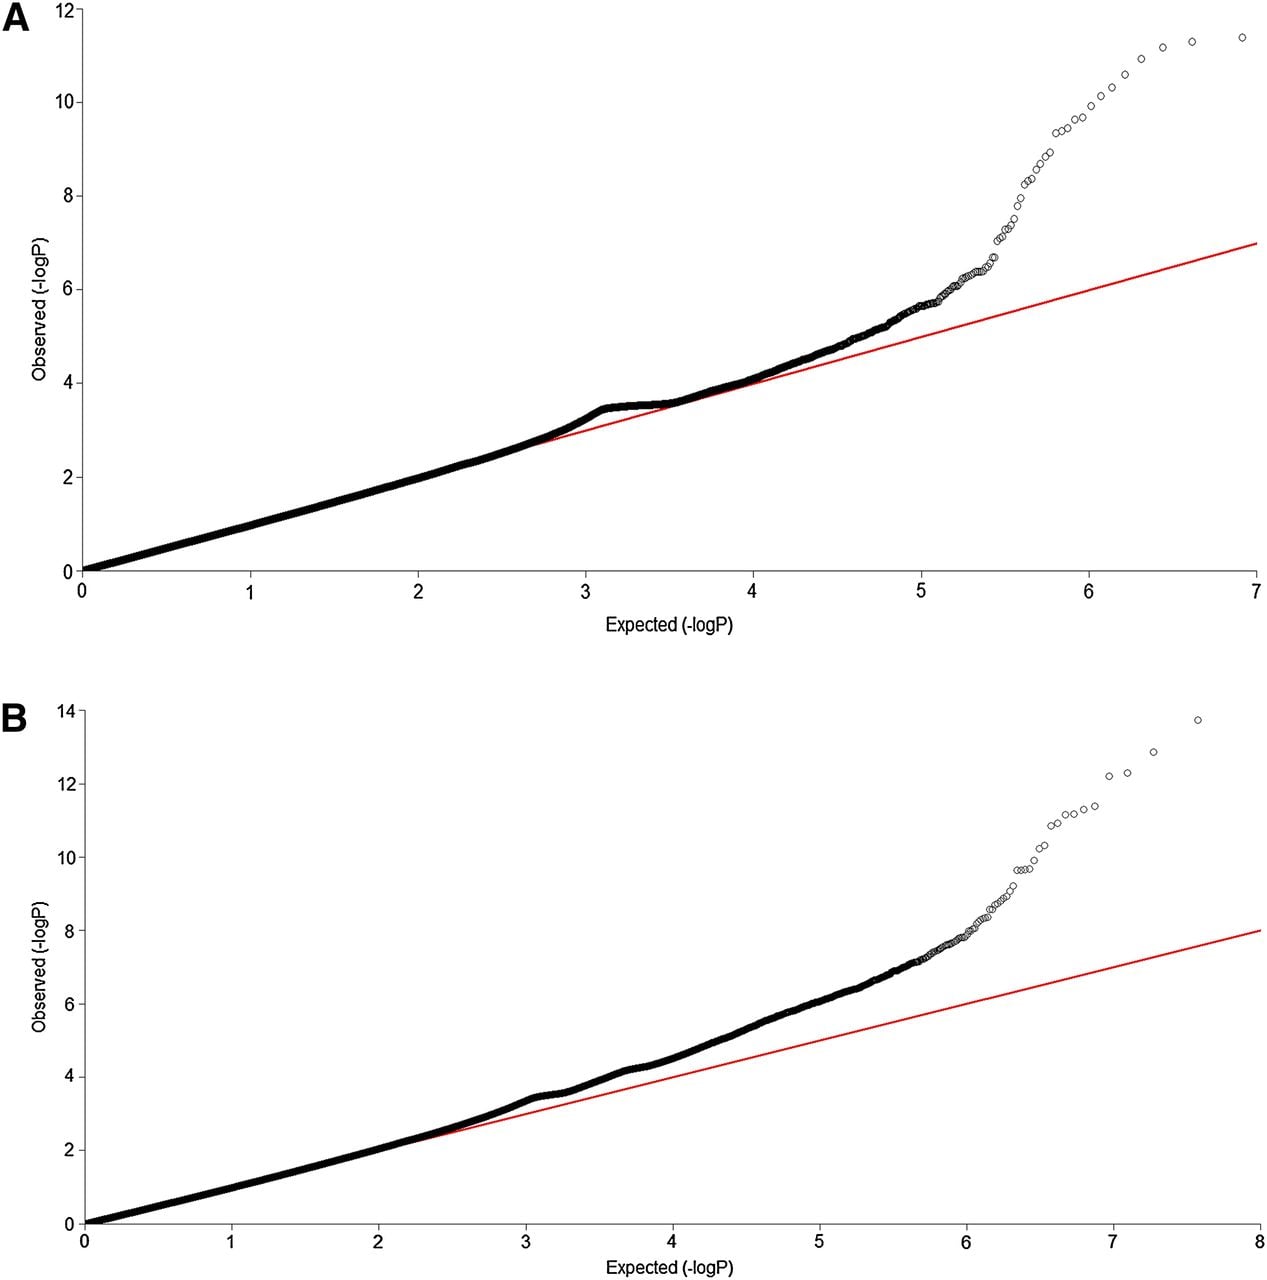
(
A
) QQ plot for the ESP data set. (
B
) QQ plot for the CHARGE-S data set.