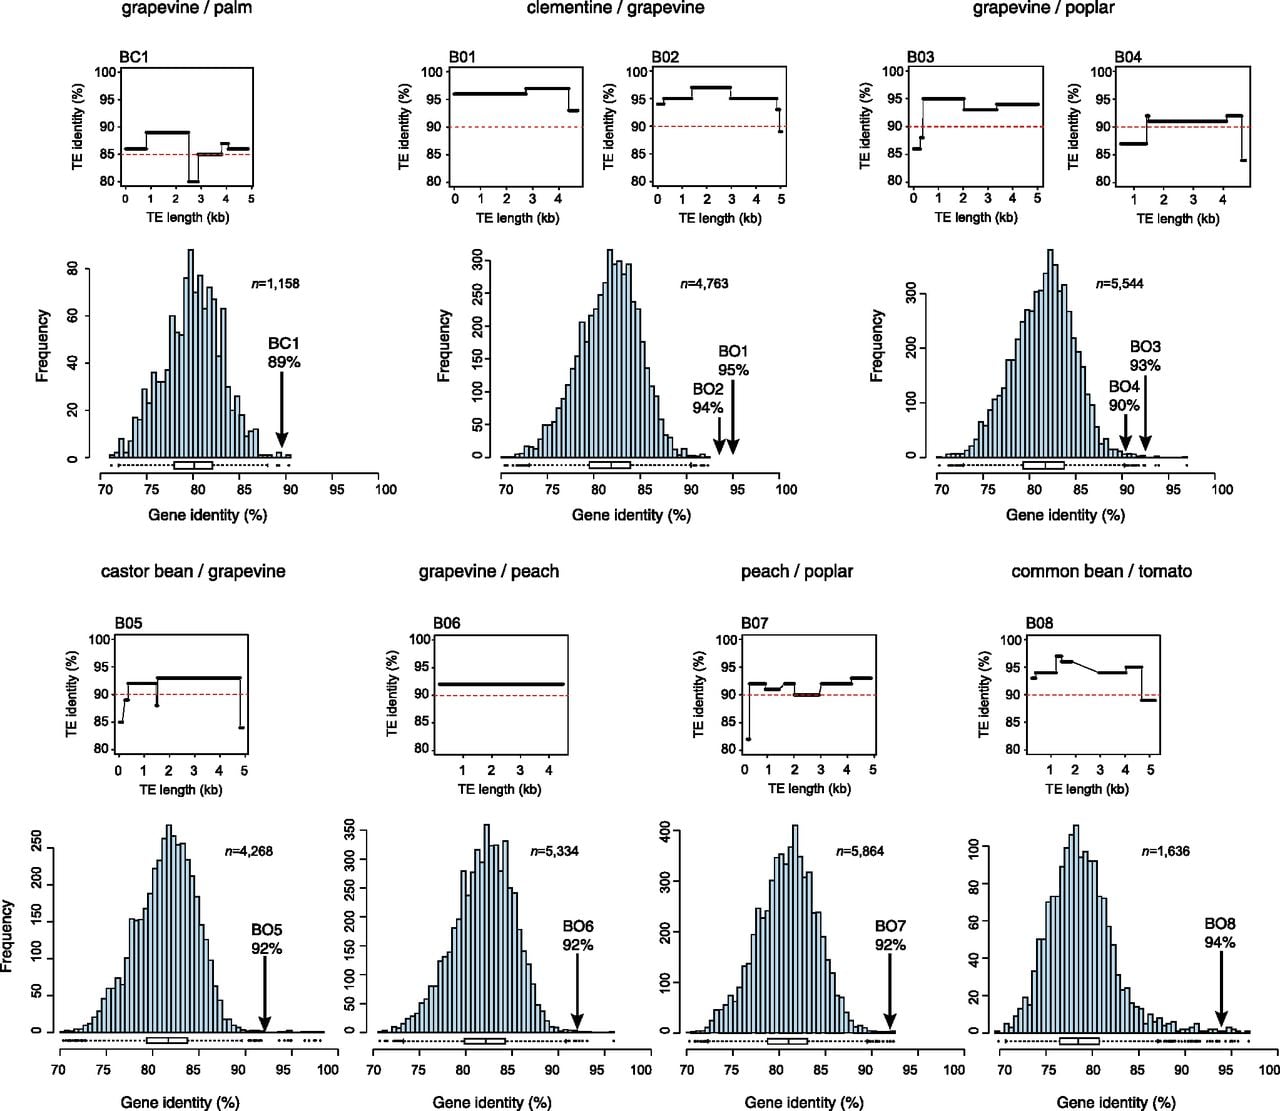
Figure 2.
Comparison between the sequence identity of LTR-RTs and the genomic distance between the species involved in BC and BO transfers. In each panel, the top graph represents the sequence identity along the complete length of the LTR-RTs involved in the transfer in both species as indicated, with the red line representing the detection threshold (85% and 90% identity for BC and BO HTTs, respectively). The histogram (in blue) represents the distribution of pairwise gene identity based on CDS comparisons (see Methods). Numbers of CDS pairs analyzed are as indicated (n). Arrows correspond to average sequence identity between the transferred LTR-RTs.