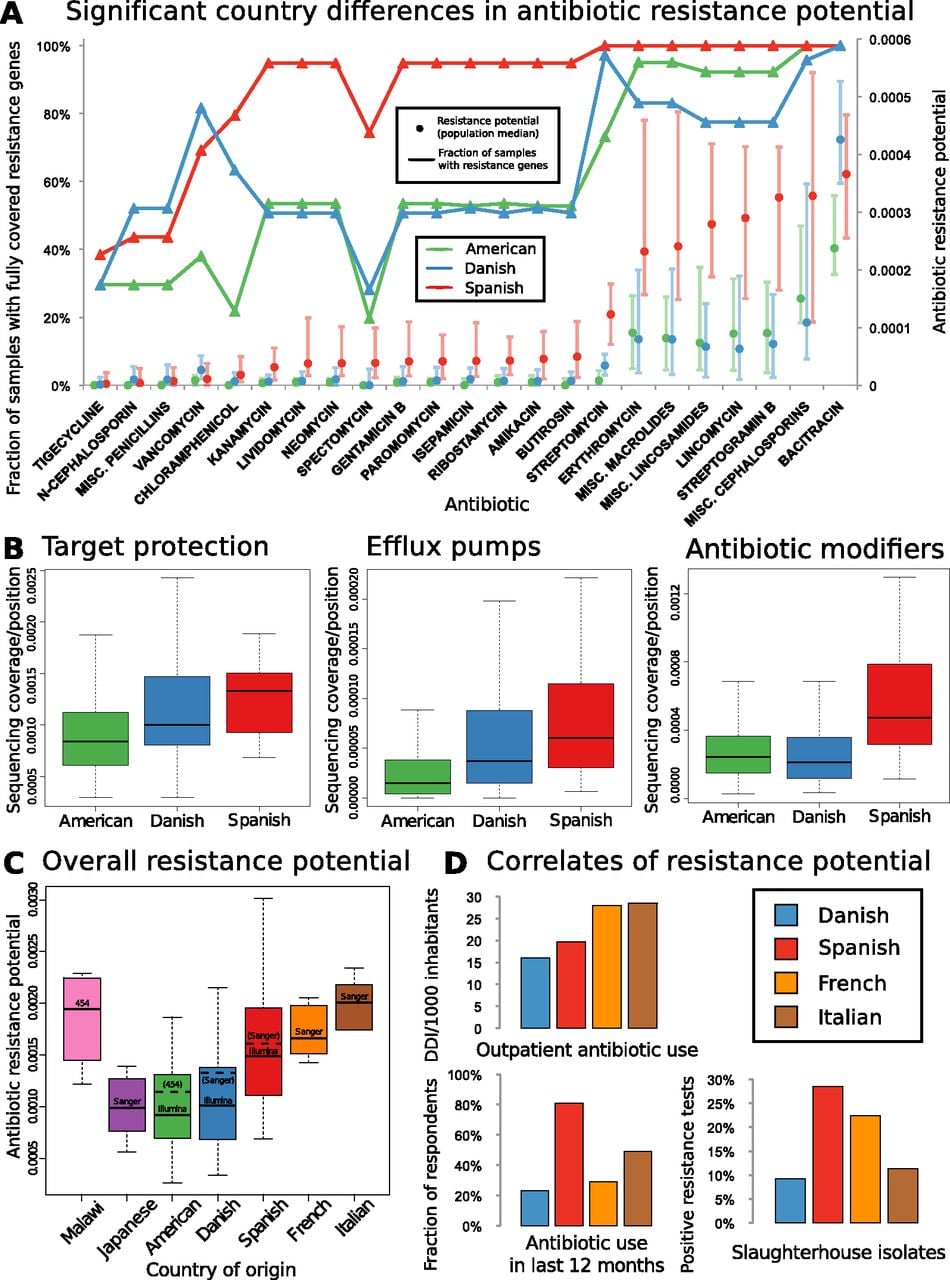
(A) Geographic differences in antibiotic resistance potential. For several antibiotics, strong and significant country differences in the respective resistance gene penetration and taxonomy-adjusted resistance potential are observed, whereby mostly those of Spanish individuals are higher than those of U.S. or Danish individuals. Antibiotics with significantly different resistance distribution between Danish (N = 71), Spanish (N = 39), and American (U.S.) (N = 142) samples are displayed, with general resistance to broad classes represented by including “miscellaneous” or “generic” members of those classes subject only to resistance from the genes with the more general annotation (see Methods). To account for cross-resistances, a multiple testing correction procedure was chosen which does not assume independence between the resistance potentials of different antibiotics (Benjamini and Yekutieli 2001). Most antibiotics that show significant country differences are approved for animal use or have analogs that are, although this is not a significant enrichment over the full set of antibiotics. All samples were stochastically down-sampled to the size of the smallest sample (∼726 Mbp) prior to the analysis. The lines/triangle markers represent the fraction of samples from each country where at least one resistance gene is fully covered by sequencing. The dot/bar markers represent median and 25%/75% quartiles for resistance potential, measured as the total resistance gene abundance for each antibiotic relative to the amount of genetic material in each sample that comes from species where any resistance genes are found. (B) Significant country differences are seen separately for antibiotic resistance genes acting by different mechanisms (Kruskal-Wallis test for countries having same median, P [drug modification] < 1.98 × 10⁻⁸, P [efflux] < 6.68 × 10⁻⁹, P [target protection] < 4.17 × 10⁻⁵). The figures show base coverage per site for resistance genes assigned to categories based on whether they operate by modifying antibiotic molecules, protecting cellular target sites, or exporting antibiotic molecules from bacterial cells. The average is taken over the resistance genes in each category, with the boxes representing the 142 American, 71 Danish, and 39 Spanish samples, respectively. (C) The higher resistance potential in Spanish than in Danish samples is also seen in other samples from southern Europe (France, Italy). The distributions are significantly different between these four countries (Kruskal-Wallis P < 1.07 × 10⁻⁵). Results are broadly in agreement between different sequencing platforms (see Supplemental Text). The samples were stochastically down-sampled to 50 Mbp prior to the analysis. (D) Gut resistance potential coincides with antibiotic exposure when comparing Denmark with southern Europe. The bar charts show comparative statistics from the literature: outpatient antibiotic consumption in 2008 from the same four countries (European Surveillance of Antimicrobial Consumption [ESAC] survey) (Goossens et al. 2005) measured in defined daily doses (DDDs) per 1000 inhabitants, frequency of antibiotic resistance in bacterial isolates from slaughterhouses in a 2011 comparative study (de Jong et al. 2012), and fraction of approximately 1000 respondents in each country that had taken antibiotics during the last 12 mo (Borg 2012). Resistance potential correlates significantly with outpatient antibiotic use (Pearson r = 0.97; t-test [N = 4, df = 2]; Bonferroni-corrected P < 0.08).