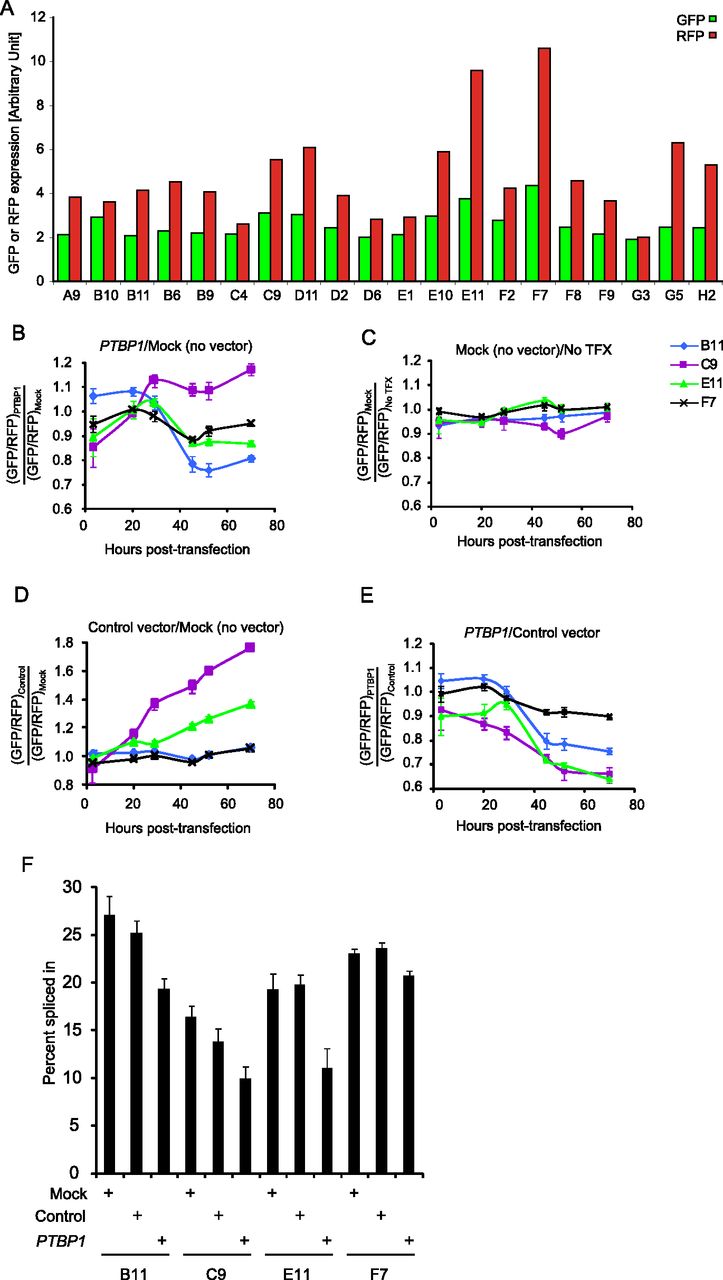
Figure 2.
Selection of stable cell lines. (A) Basal GFP and RFP expression vary between different pflareG-exon 18 stable cell clones. (B–E) Changes in the GFP/RFP ratios of B11 (blue), C9 (purple), E11 (green), and F7 (black) cells after reverse transfection of a PTBP1 expressing vector (PTBP1), mock transfection without DNA (Mock), transfection of a empty control vector, or no transfection (no TFX). (F) Percent-spliced-in values of exon 18 in the pflareG-exon 18 mRNA in B11, C9, E11, and F7 cells after different transfection.