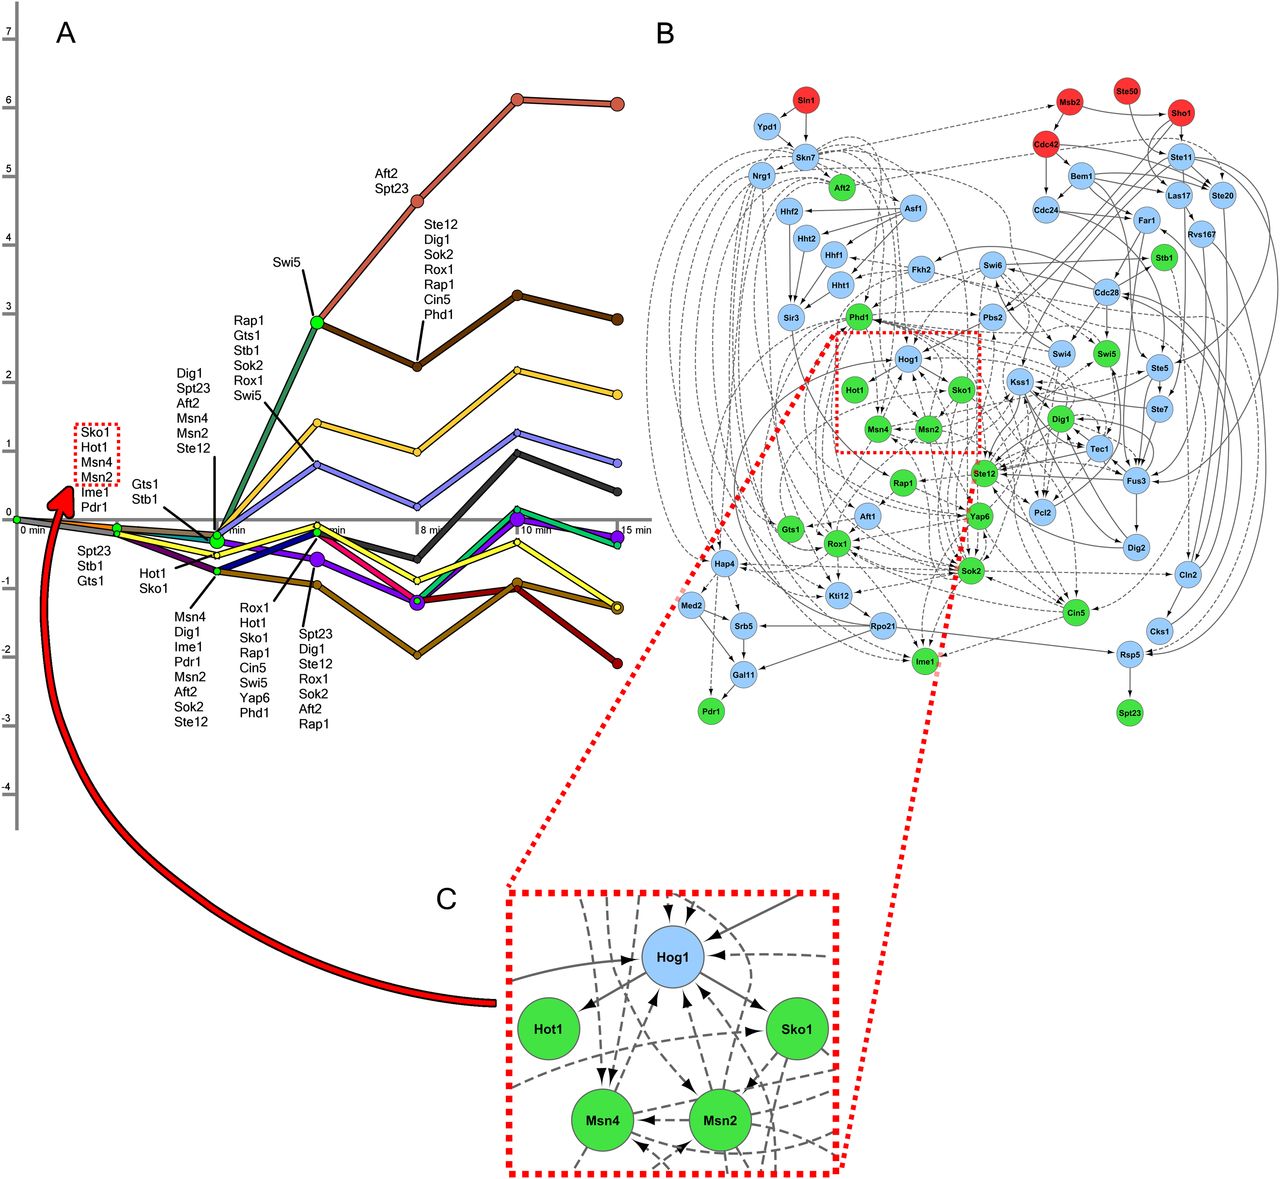
Short osmotic stress model. (A) The regulatory part of the model contains 10 paths in the short time-series data, where each path represents a collection of gene expression profiles. The x-axis displays the time points at which gene expression is measured. The y-axis shows log2 fold change in expression. The nodes following a bifurcation event are annotated with the TFs that are predicted to control the split, providing temporal resolution to the static protein–DNA interaction data. TFs are only shown the first time they are active along a regulatory path. (B) This subset of the oriented interaction network contains three types of nodes: upstream proteins given as sources (red), predicted signaling proteins (blue), and active TFs from DREM (green). The blue nodes consist of all proteins that appear in at least 1% of high-scoring paths and are not sources or targets. Dashed edges are protein–DNA interactions, and solid edges are oriented PPIs. (C) An enlarged view of a subsection of the interaction network identified shows that the core transcriptional unit of the HOG pathway was recovered. These TFs were inferred in the regulatory component of the model, and the network displays SDREM's explanation of how they are activated.