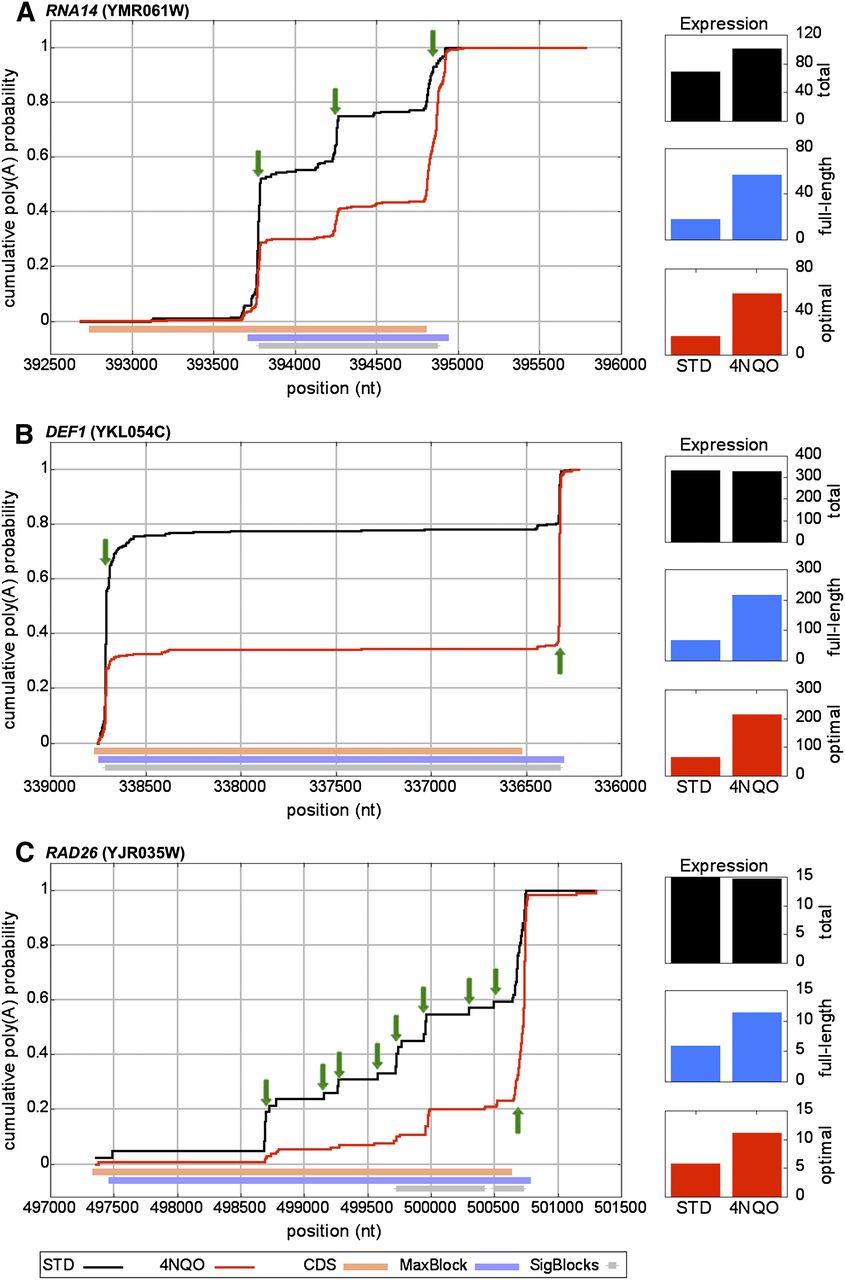
Cumulative polyadenylation distribution (CPD) plots for genes that shift to longer isoforms with exposure to 4NQO. CPD plots are presented for (A) RNA14, (B) DEF1, and (C) RAD26. In all panels, black and red line-plots represent the CPD without and with exposure to 4NQO, respectively. Orange bars show CDS positions, with all plots oriented such that the 5′-3′ direction of transcription is left to right. Light blue bars identify the largest block of difference between 4NQO and STD samples, and are displayed if the block was measured as significant. Gray bars show all significantly differing regions in the CPD after 4NQO exposure. Green arrows show prominent poly(A) sites. Normalized expression levels were calculated for total (black column plot), full-length (blue column plot), and optimal transcripts (red column plot).