Figure 2.
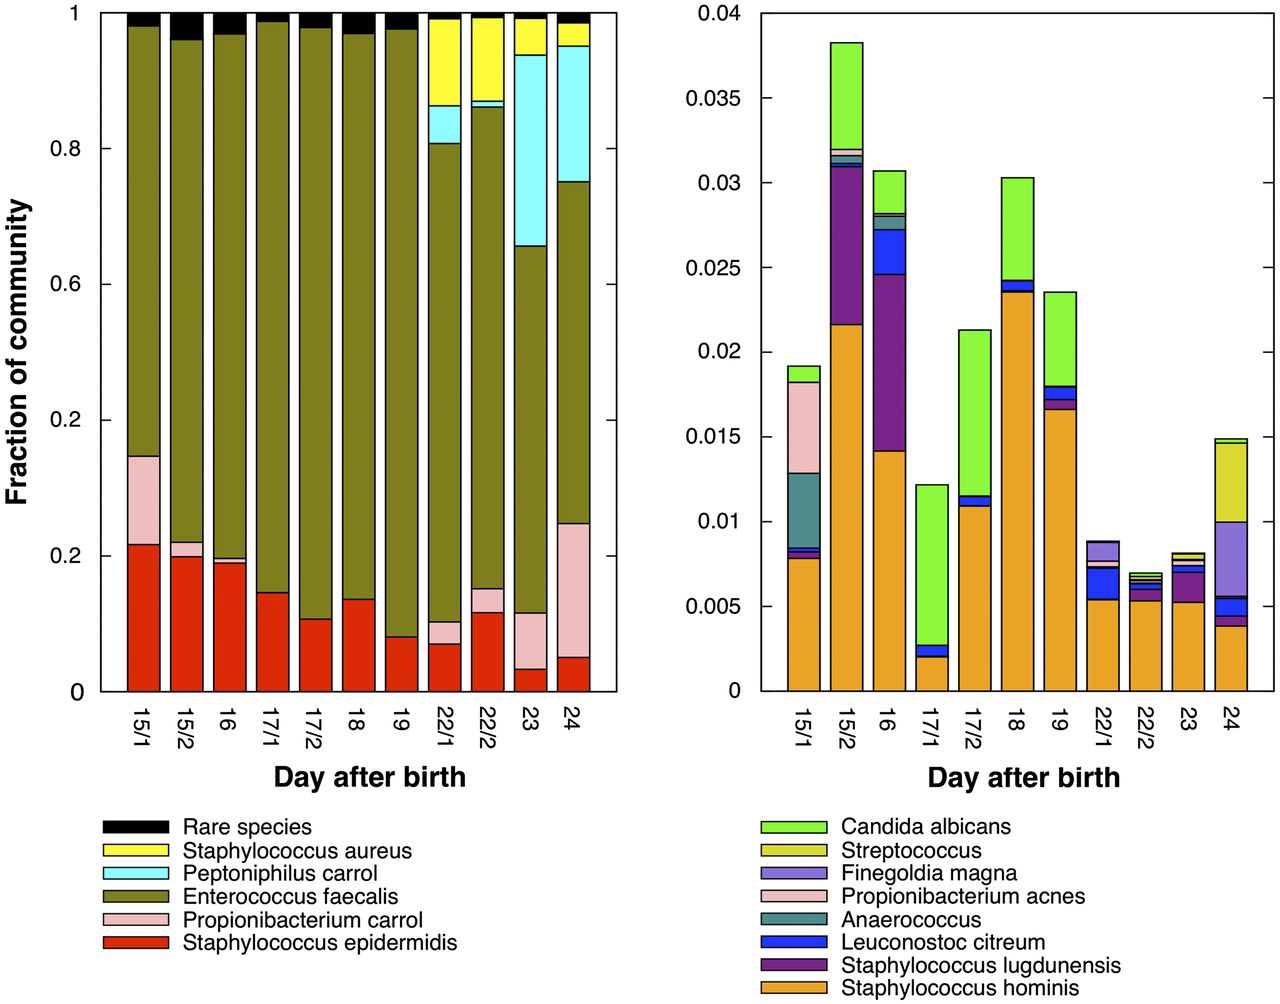
Relative abundance in the community of abundant (left) and rare (right) species. Abundance was computed based on read mapping to unique regions on the assembled genomes.
Relative abundance in the community of abundant (left) and rare (right) species. Abundance was computed based on read mapping to unique regions on the assembled genomes.