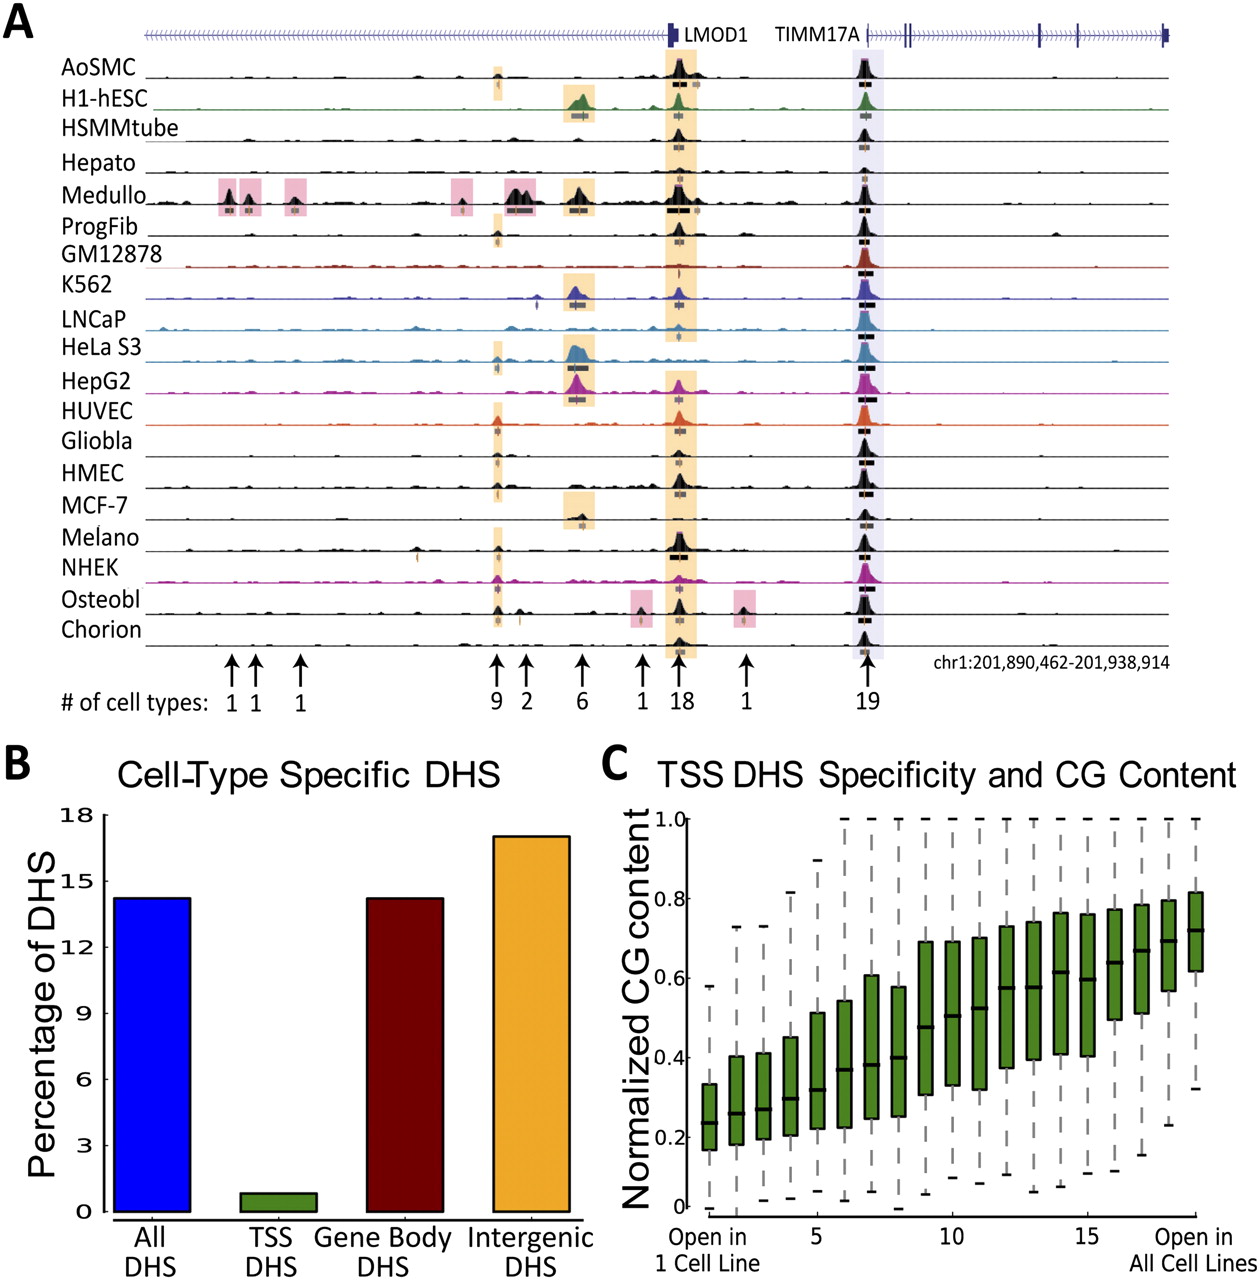
Figure 2.
Cell-type specificity of hypersensitive regions. (A) Example (Chr1: 201,890,462–201,938,914) showing cell-type–specific DHSs across two cell lines (pink boxes). Note that we called a DHS cell-type–specific if it did not overlap another DHS by more than half in any of the 18 other cell lines. (B) Bar graph showing the proportions of cell-type–specific DHSs across different genomic locations averaged across all cell lines. (C) TSSs were divided by the number of cell lines that they overlapped in a region of open chromatin. For each set of TSSs, normalized CG content in the promoter regions (−900,100) of the TSSs are shown.