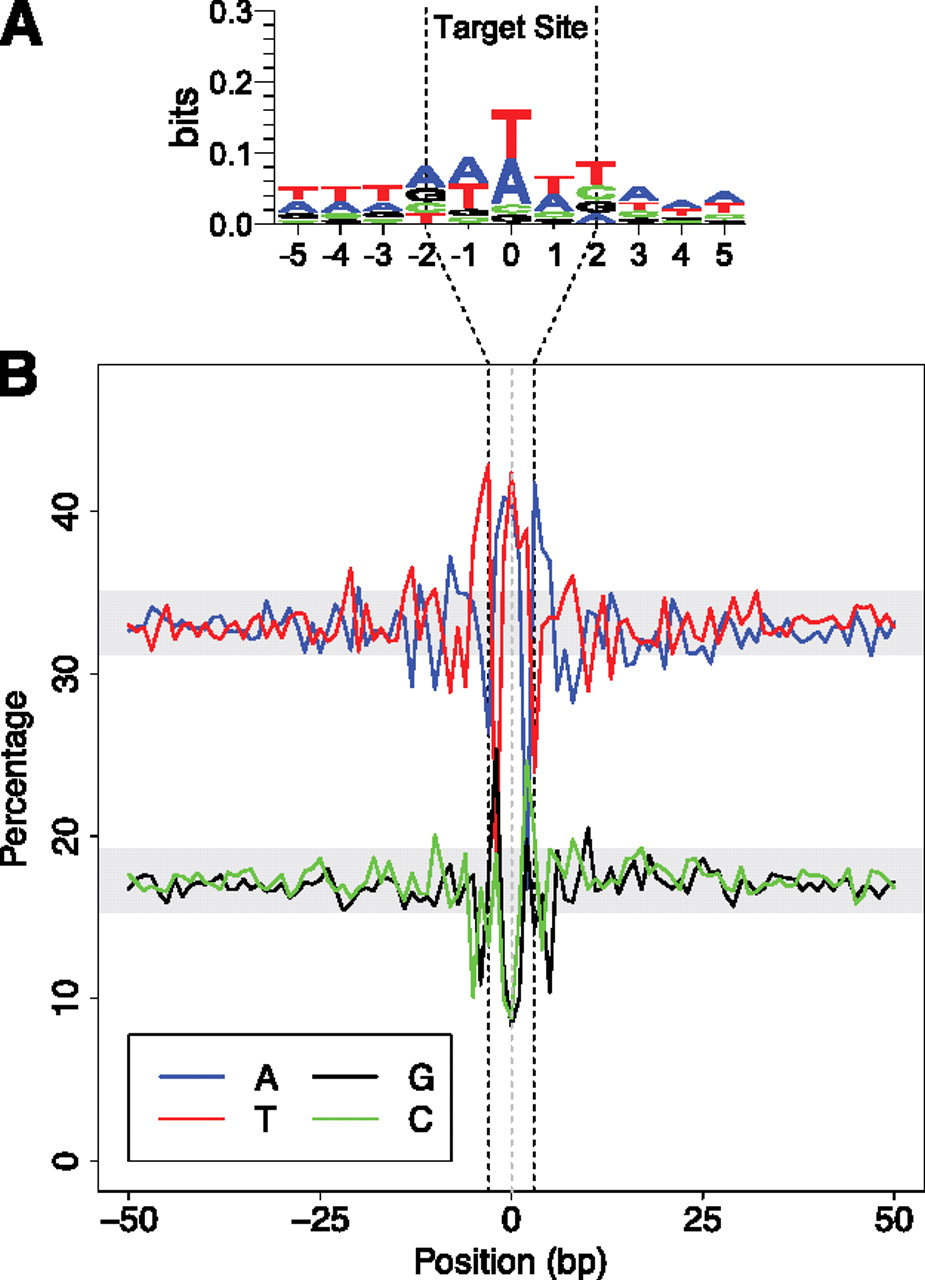
Figure 2.
Departures from randomness in Ty1 target sequences. (A) Sequence logo showing the TSD and bases immediately flanking it. (B) Plot of deviations from randomness of individual bases in the 100-bp window surrounding the TSD. For comparison, gray bars depict the span of the first and third quartile of composition of the yeast genome.