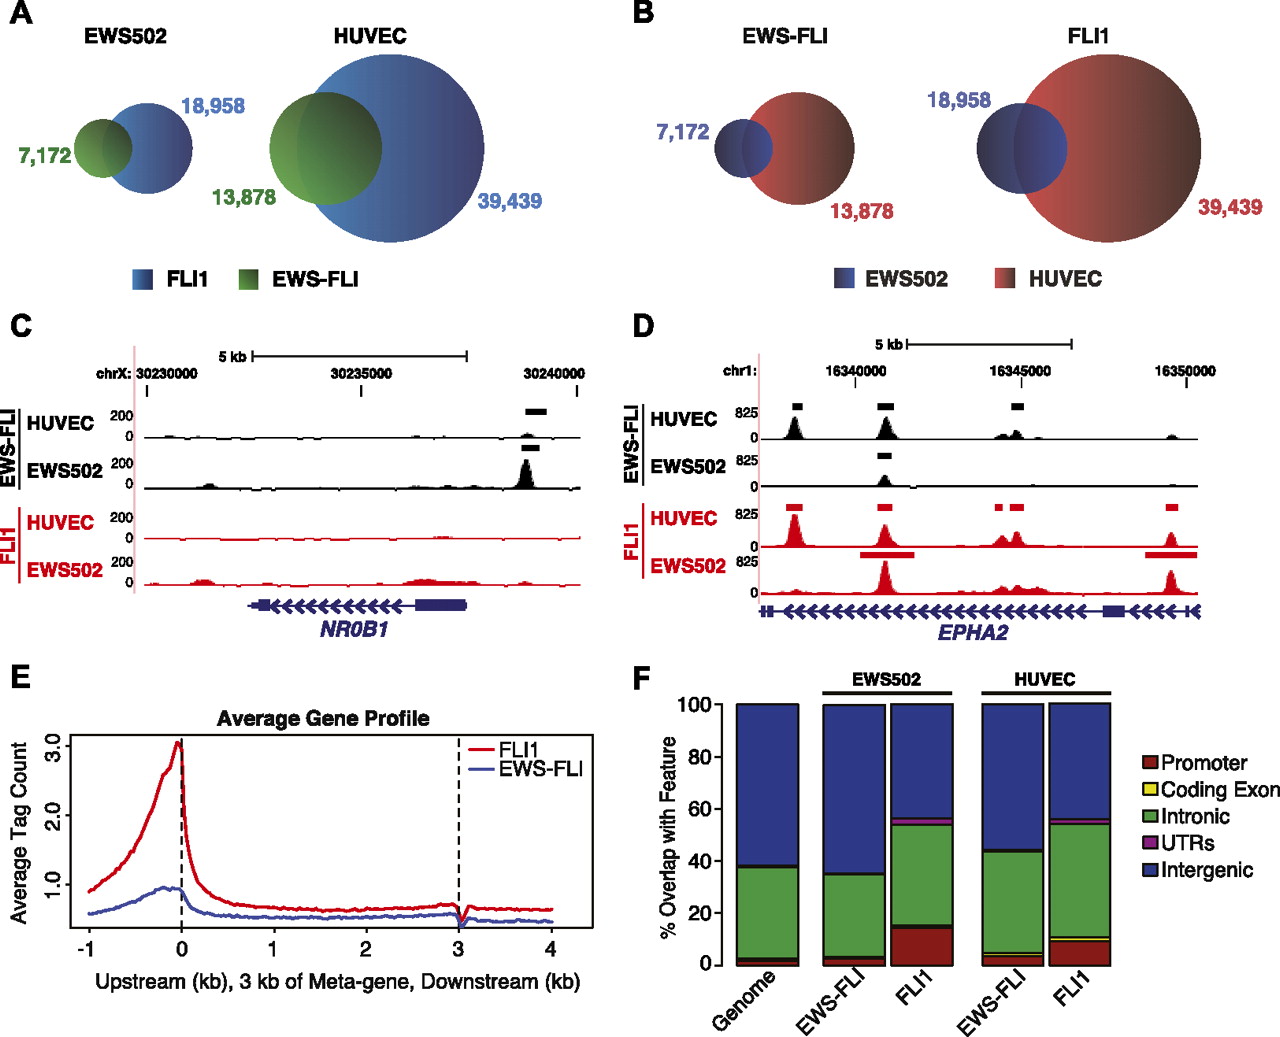
Figure 2.
Chimerism alters ETS-mediated targeting. (A,B) Venn diagrams showing the number of unique and overlapping EWS–FLI and FLI1 binding regions within the same cell type (A) or across cell types (B). (C,D) UCSC Genome Browser screenshots of EWS–FLI and FLI1 ChIP-seq signal at two genes: NR0B1 (C) and EPHA2 (D). Horizontal bars indicate targeted sites identified by ZINBA. Tag counts are shown in the y-axis. (E) Meta-gene profile of EWS–FLI and FLI1 ChIP-seq reads; 1 kb upstream of the TSS through 1 kb downstream from transcriptional termination is represented. (F) Percent overlap of ZINBA-identified EWS–FLI and FLI1 binding sites with major functional genomic features. Genomic distribution of features (Genome) is shown for comparison.