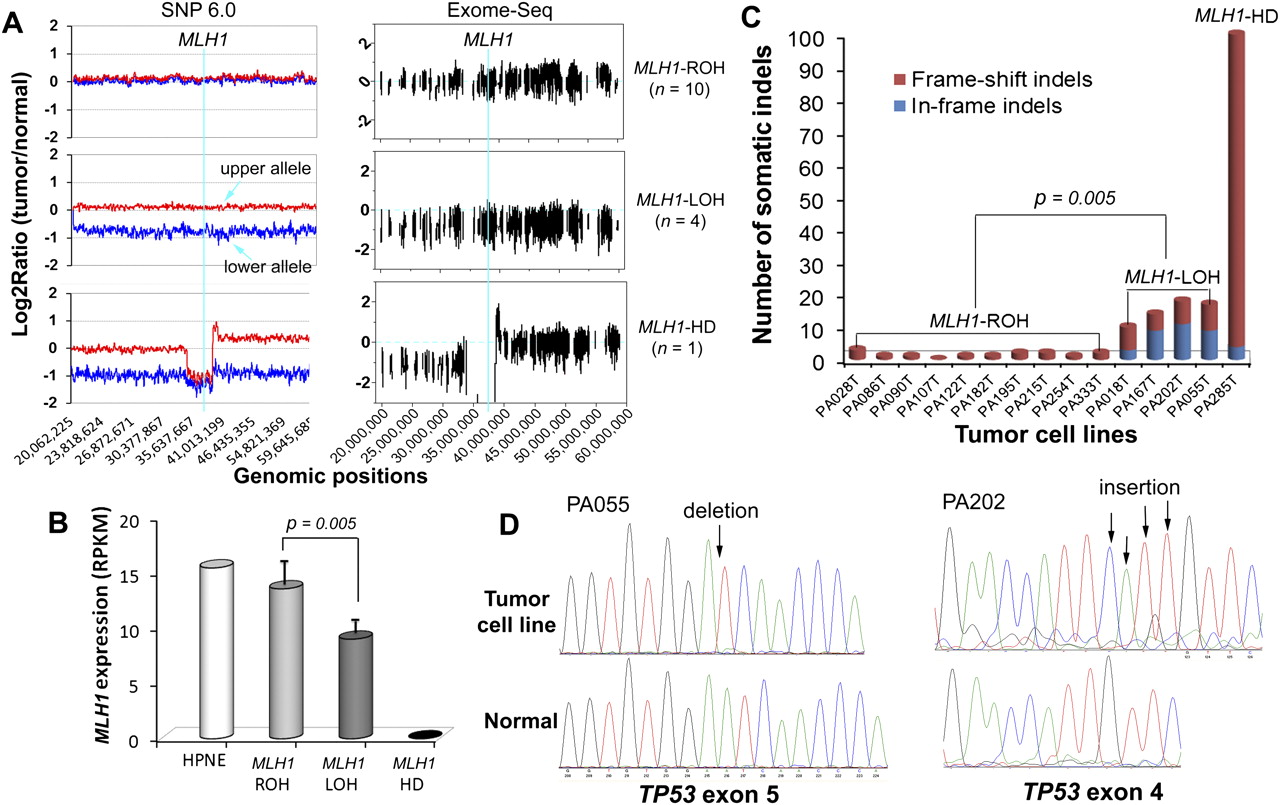
Allelic loss of MLH1 and the increased rate of somatic indel mutations. (A) The distinct DNA copy-number status of MLH1. The left and right panels show the DNA copy-number status inferred from SNP array and Exome-seq data, respectively. The line in light blue indicates the approximate genomic location of MLH1. For graphs in the left panel, the y-axis indicates the adjusted log2 ratios of signal intensities between the tumor cell line and its matched normal sample for perfect match probes. The red line represents the allele with a higher copy number, and the blue line represents the allele with a lower copy number. The log2 ratio of −1 and 0 theoretically corresponds to 0 and 1 copy, respectively. For graphs in the right panel, the y-axis indicates the log2 ratios of the sequence coverage between the tumor cell line and its matched normal sample for targeted exonic regions. (B) The differential expression of MLH1. The gene expression level was examined by mRNA-seq. (RPKM) Reads per kilobase per million mapped reads. (Bars) Mean ± SD. (C) The somatic indels. The number of somatic small indels identified in the targeted exonic regions is shown for each tumor cell line. (D) Validation of the truncating indels identified in TP53 in two MLH1-LOH cell lines. (Left) 1-bp deletion; (right) 4-bp insertion. The positions of indels are indicated by arrows in the sequence electropherograms.