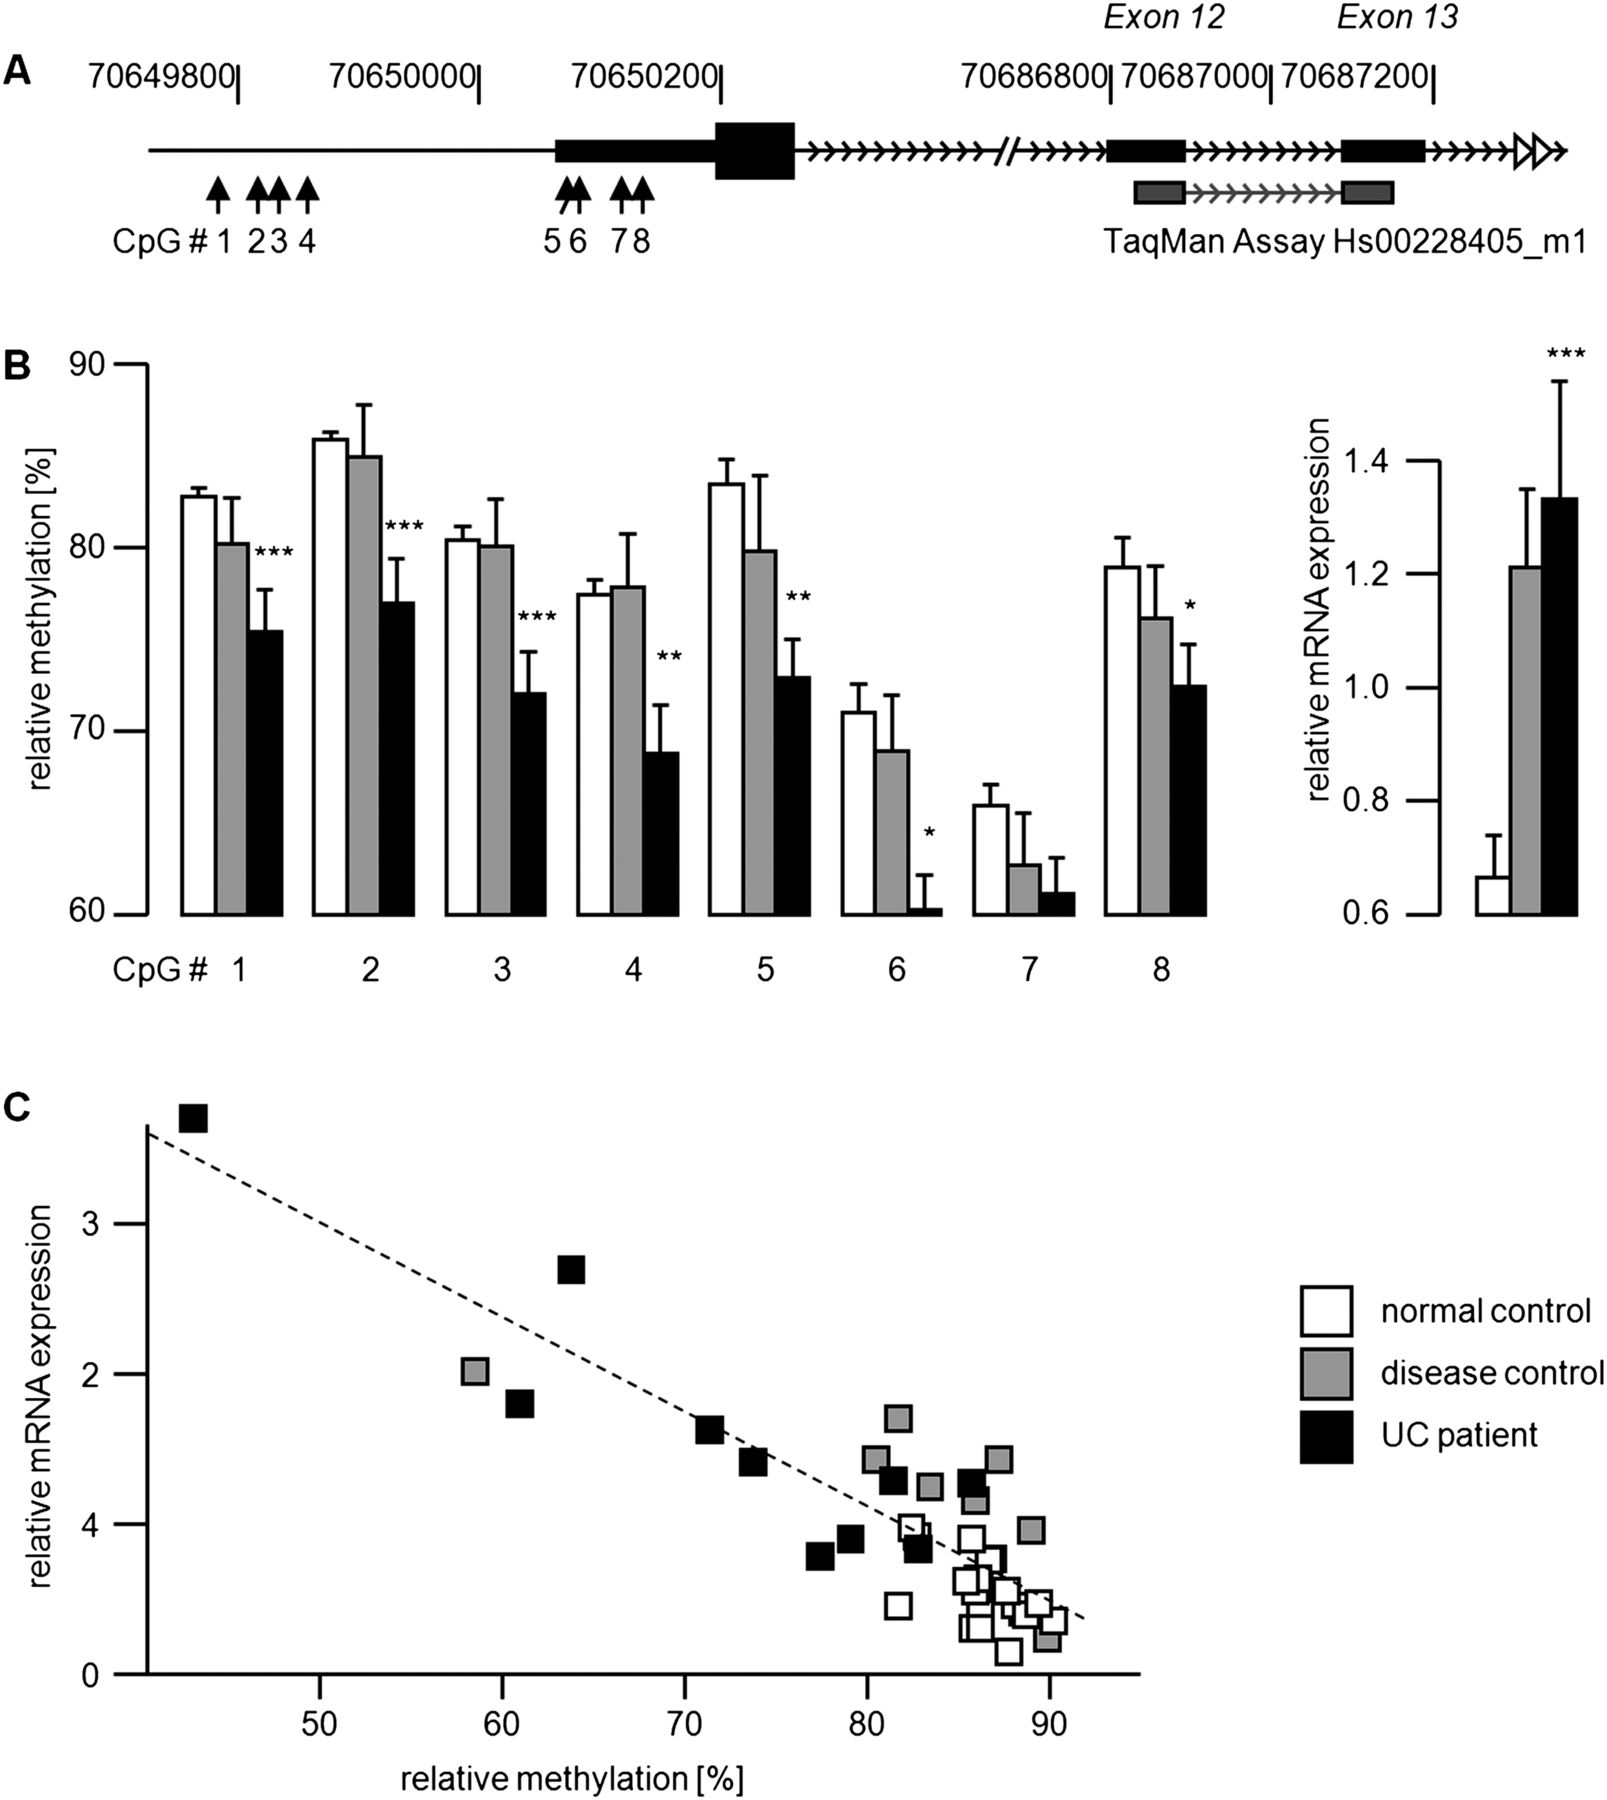
Validation of DNAm and gene expression in selected candidate transcripts; example: HKDC1. (A) Relative position of CpGs (arrows up, continuously numbered 1–8) and real-time PCR probe (dark gray). (B) Quantitative results of the validation: (1) methylation (via pyrosequencing, CpGs continuously numbered 1–8 in concordance with Fig. 2A) in n = 50 individuals (validation panel II); the order of assays displayed corresponds to the order in Figure 2A; (2) mRNA (via real-time PCR, right) in n = 135 individuals (validation panel I). (C) Correlation between mRNA expression (x-axis) and relative methylation (y-axis) in HKDC1 for a selected CpG; the dotted line represents the correlation trend (Spearman-ρ r = −7.43). Significant differences between UC patients and normal controls are indicated by asterisks ([*] P ≤ 5 × 10⁻³; [**] P ≤ 5 × 10⁻⁴; [***] P ≤ 5 × 10⁻⁶).