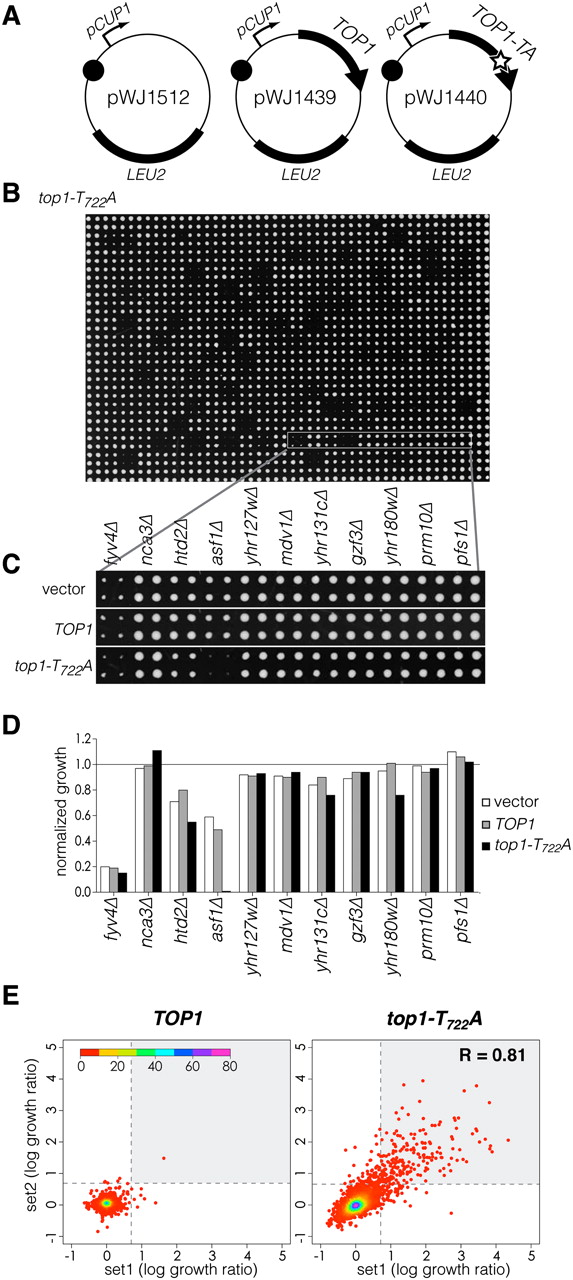
Screening the haploid yeast gene disruption library using DNA topoisomerase I alleles. (A) Expression plasmids for DNA topoisomerase I were constructed as single-copy CEN-based plasmids (black circle) using LEU2 as a dominant selectable marker. The control plasmid (pWJ1512) contains only the copper-inducible promoter from the yeast CUP1 gene. The wild-type TOP1 gene is cloned in front of this promoter in the pWJ1439 plasmid. The mutant allele is cloned into pWJ1440 and contains a T722 to A substitution near the active site (star) that stabilizes the covalent catalytic intermediate and causes DNA damage. (B) The result of plasmid transfer by SPA into an arrayed strain library. Each strain from a set of 384 is quadruplicated onto a 1536 grid so that the four replicate strains make a 2 × 2 square. Growth of the strains after 3 d on 100 μM Cu to induce top1 expression is shown. (C) Mutant phenotypes are scored by growth differences caused by the different plasmids. The highlighted row shows that most strains exhibit the same growth regardless of the plasmid that is transferred. The asf1▵ strain is the exception and does not grow when the mutant top1 allele is transferred. (D) Quantification of colony growth is achieved using digitized plate images (see main text). The bar graph shows the values from the average strain growth of the colonies shown in C normalized to the median growth value of the plate. (E) Data collected from two separate screens of the gene-disruption library are represented as a scatter plot with each point showing the log growth ratios for an individual strain as x and y coordinates. Points drawn on the graph are colored according to density (inset color bar shows scale). The correlation statistic comparing the combined screens of the top1-T722A mutant is shown in the inset (R = 0.81).