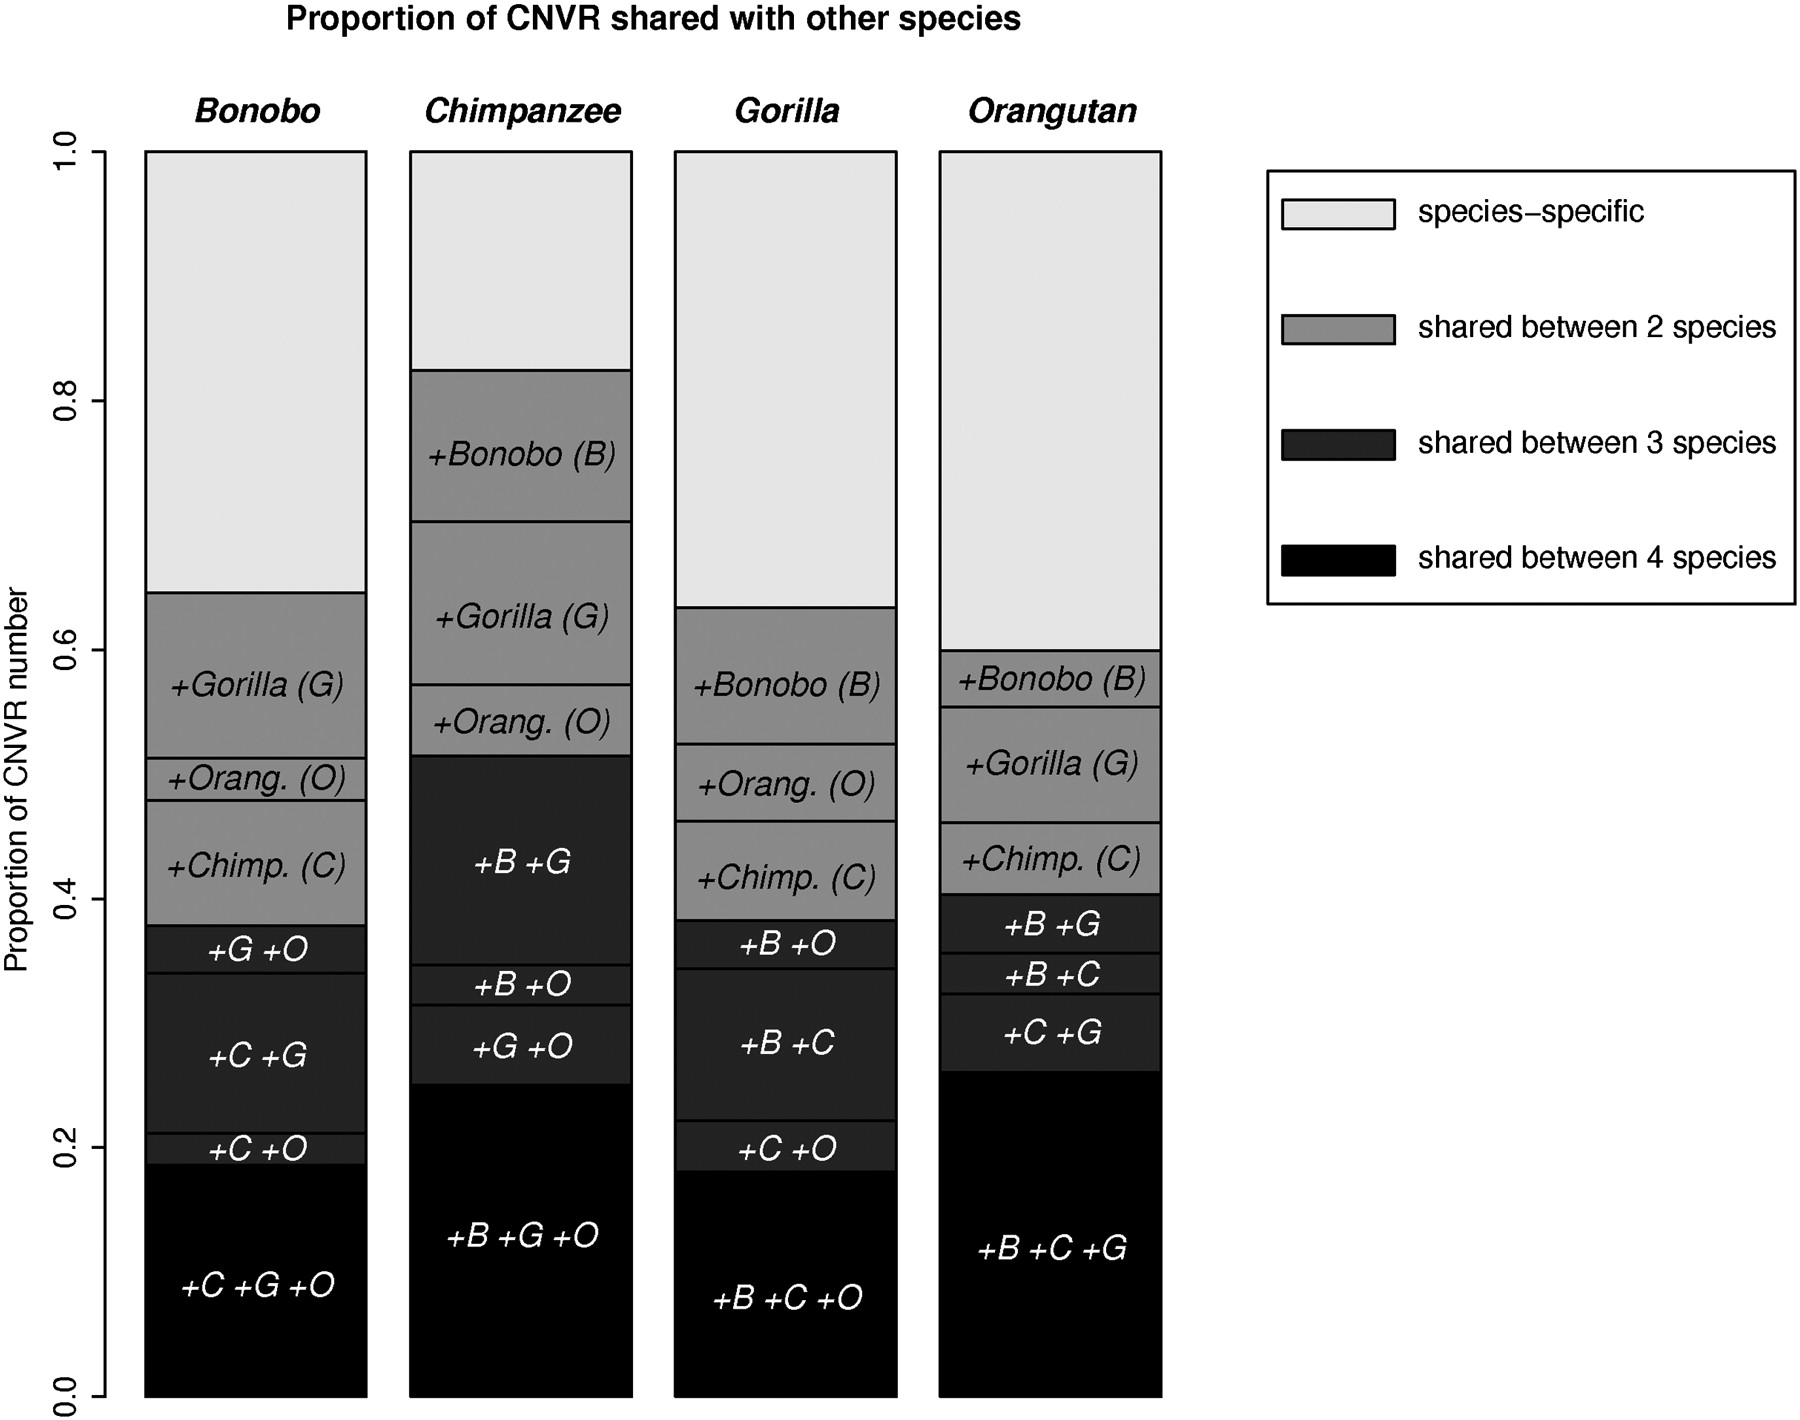
Figure 2.
CNVR interspecific comparison. For each species, the proportion of its CNVR shared with none, one, two, or three other species is plotted.
CNVR interspecific comparison. For each species, the proportion of its CNVR shared with none, one, two, or three other species is plotted.