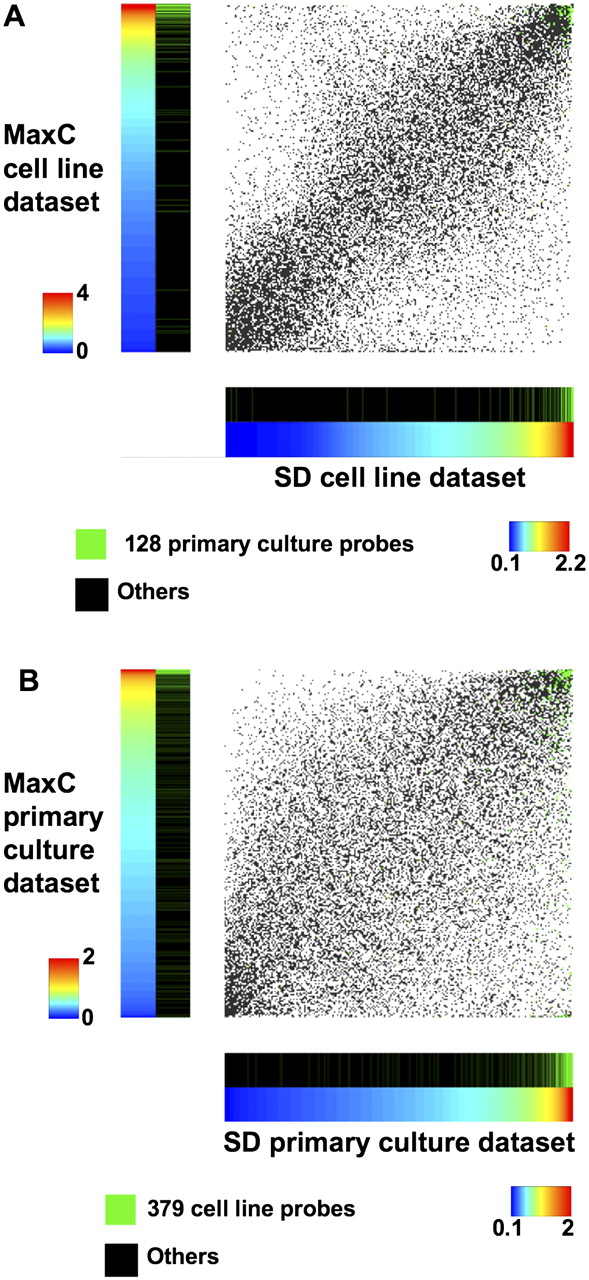
Figure 2.
Concordance between predictions from primary cultured cell and cell line data of candidate methylated genes. (A) Enrichment of the 128 candidate methylated gene probes (green lines in black color bar; other probes, black lines; in scatter plot, green dots) from primary cultured cancer cells based on the thresholds for MaxC and SD defined by analysis of the cell line data. (B) Enrichment of the 379 candidate methylated gene probes from the cell line data set (in black color bar, green lines; other probes, black lines; in scatter plot, green dots; other probes, black dots) based on thresholds for MaxC and SD defined by the primary culture data set.