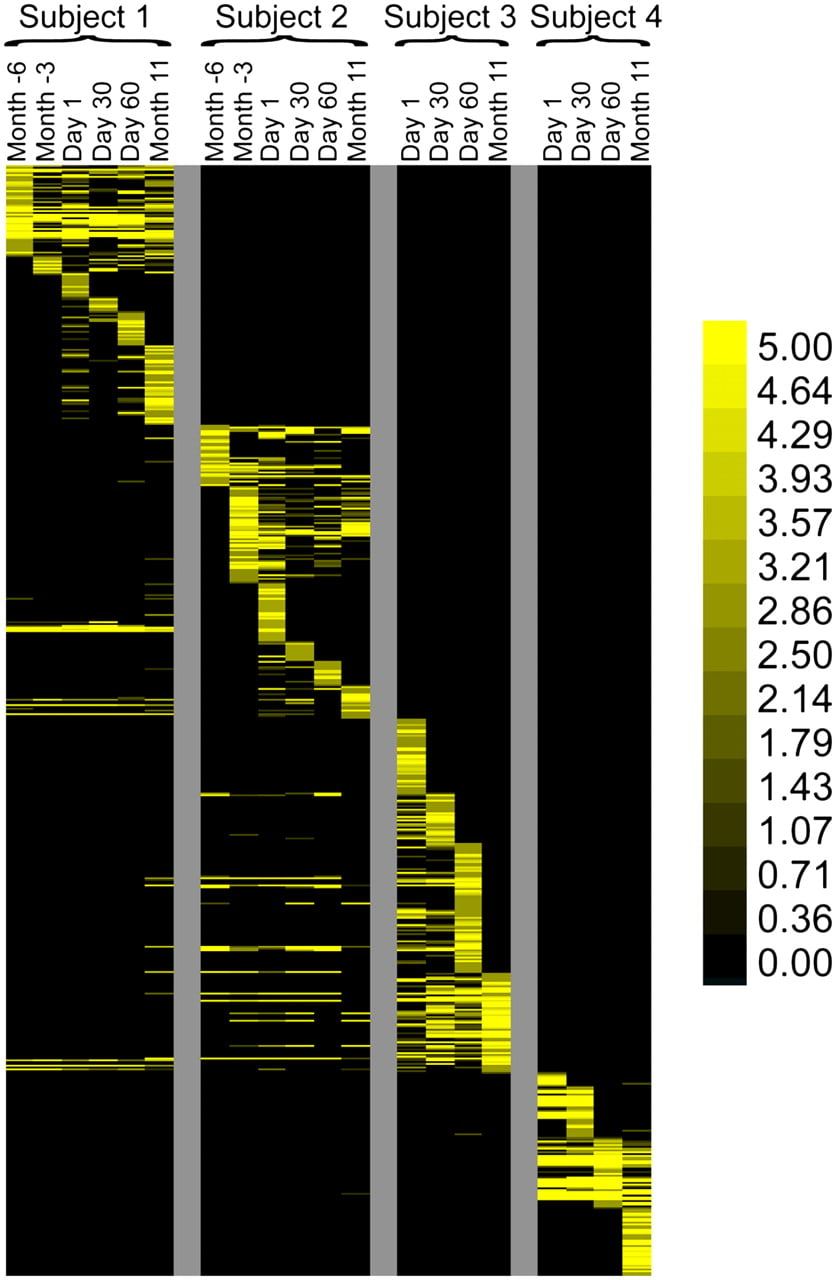
Figure 2.
Heatmap of unique spacers present in each subject at all time points. Each row represents a unique spacer sequence. The intensity scale bar is located to the right.
Heatmap of unique spacers present in each subject at all time points. Each row represents a unique spacer sequence. The intensity scale bar is located to the right.