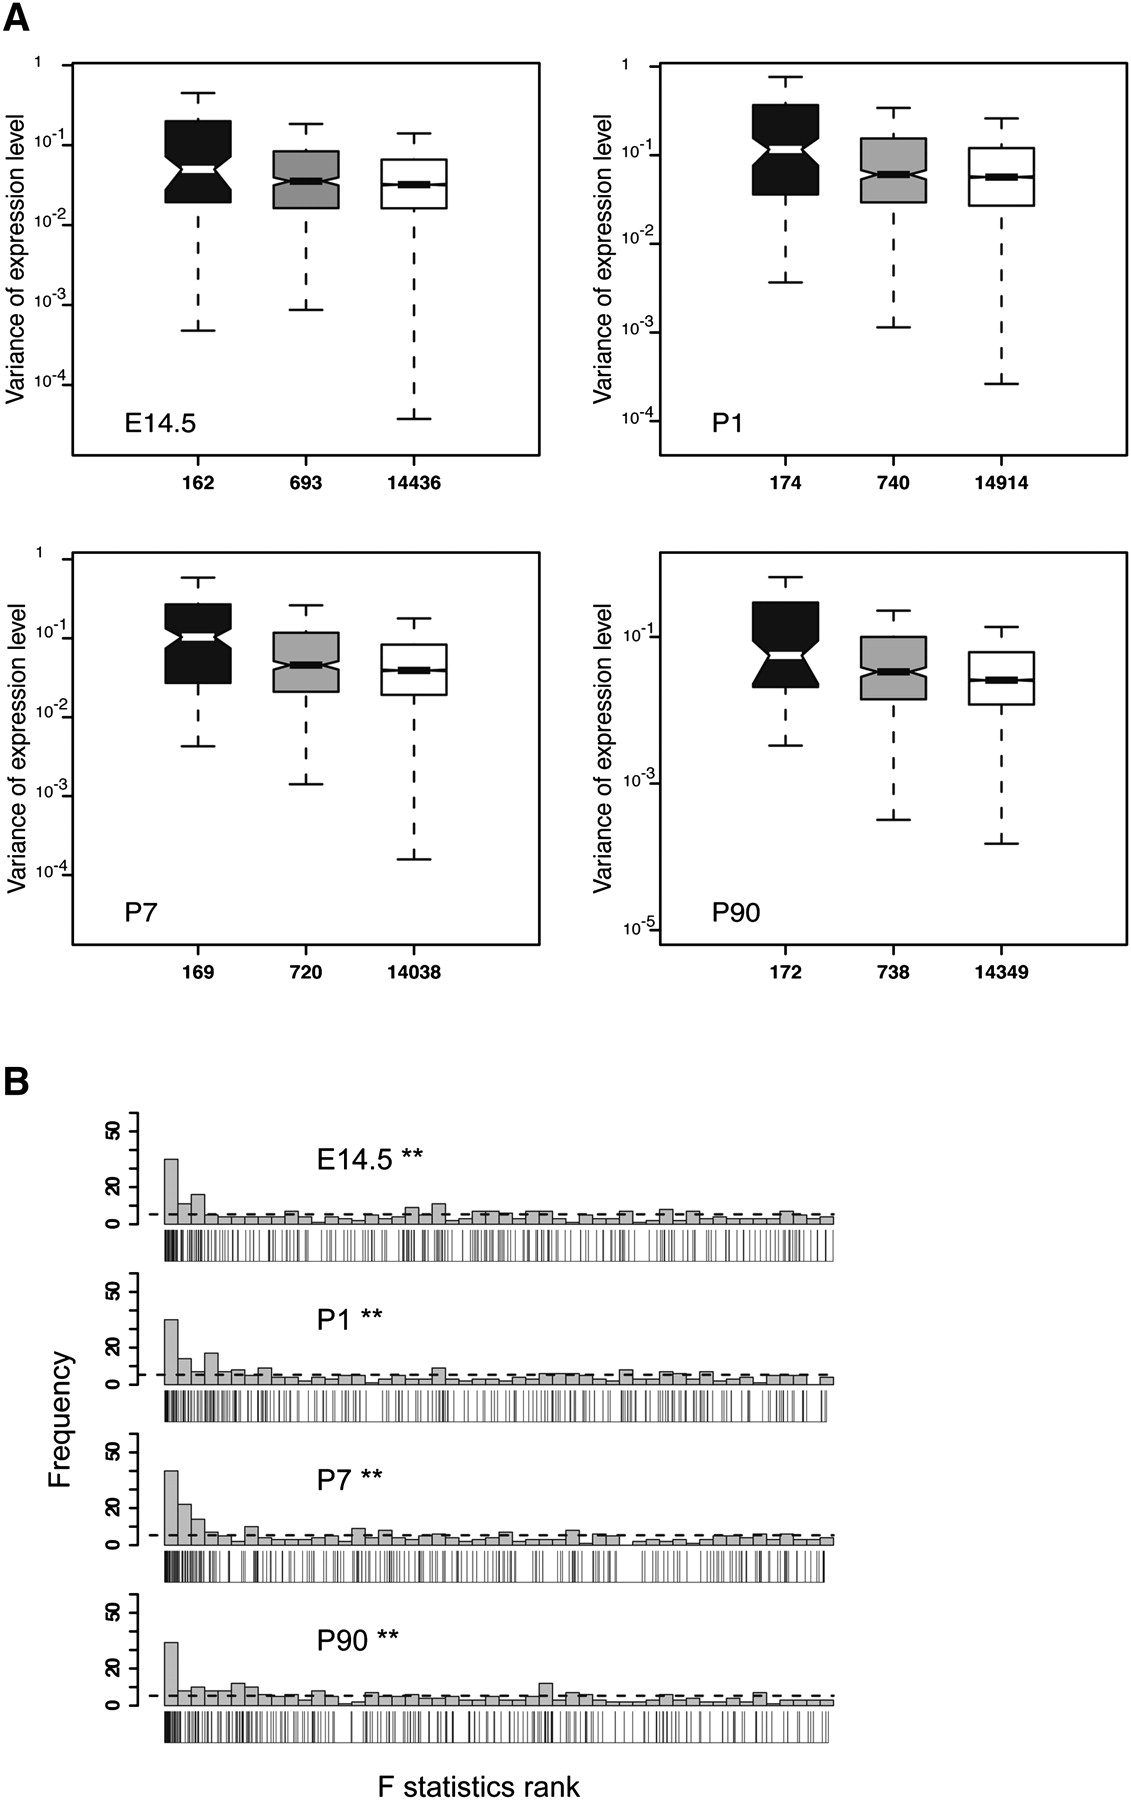
(A) Expression throughout development of genes within CNVs, in neighboring regions, and elsewhere in the genome. Boxplot distribution of signal variances (nine individuals, three strains) of transcripts expressed in the liver at E14.5, P1, P7, and P90, and mapping within CNVs (black), 50–250 kb from the nearest CNV breakpoint (gray), or further away (white). The black (largest two-tailed Mann-Whitney U test, P = 1.3 × 10⁻⁷) and the gray distributions (largest two-tailed Mann-Whitney U test, P = 0.02) are significantly different from the white in all monitored tissues. The numbers of transcripts for which expression could be detected are indicated. Similar results were obtained for brain transcripts (Supplemental Table S1). (B) Overrepresentation of CNV genes among differentially expressed genes. For each gene, we calculated the F statistics representing the differential expression of transcripts in each tissue and developmental time point using the Bioconductor limma package. We then ranked genes by their F-statistic and binned the ranked genes into 50 bins. For each tissue and time point, we display the number of CNV genes in each bin, ordering bins from the highest F-statistic on the left to the lowest F-statistic on the right; the number of CNV genes is given by the height of the bar and CNV genes in each are indicated by tick marks below the histogram. Data from the liver at each time point are shown here as examples; similar results were obtained for brain transcripts (see text for details). Under the assumption that genes are equally likely to be CNV genes independent of their expression differences, the number of CNV genes should be uniformly distributed among bins, as indicated by the dashed line. We tested this assumption using a two-tailed Mann-Whitney U test. The assumption of uniform distribution was rejected for both brain and liver at all developmental stages assessed (**P < 0.001), indicating an overrepresentation of CNV genes among differentially expressed genes throughout development.