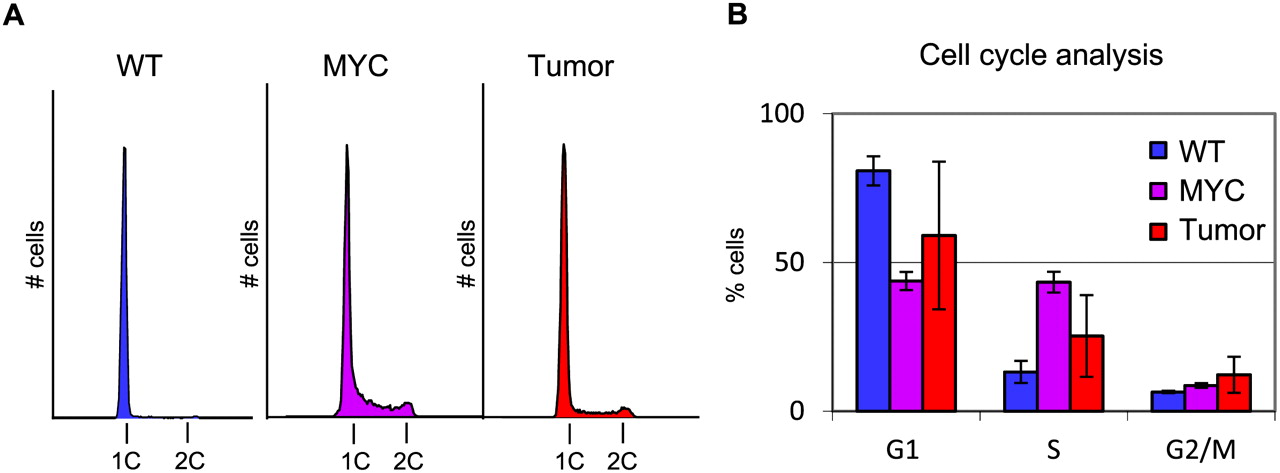
Figure 2.
Cell cycle analysis of DNA content during cell state changes. (A) Examples of FACS plots. (B) Five samples of each cell type were analyzed and averaged. DAPI staining was used for cell sorting.
Cell cycle analysis of DNA content during cell state changes. (A) Examples of FACS plots. (B) Five samples of each cell type were analyzed and averaged. DAPI staining was used for cell sorting.