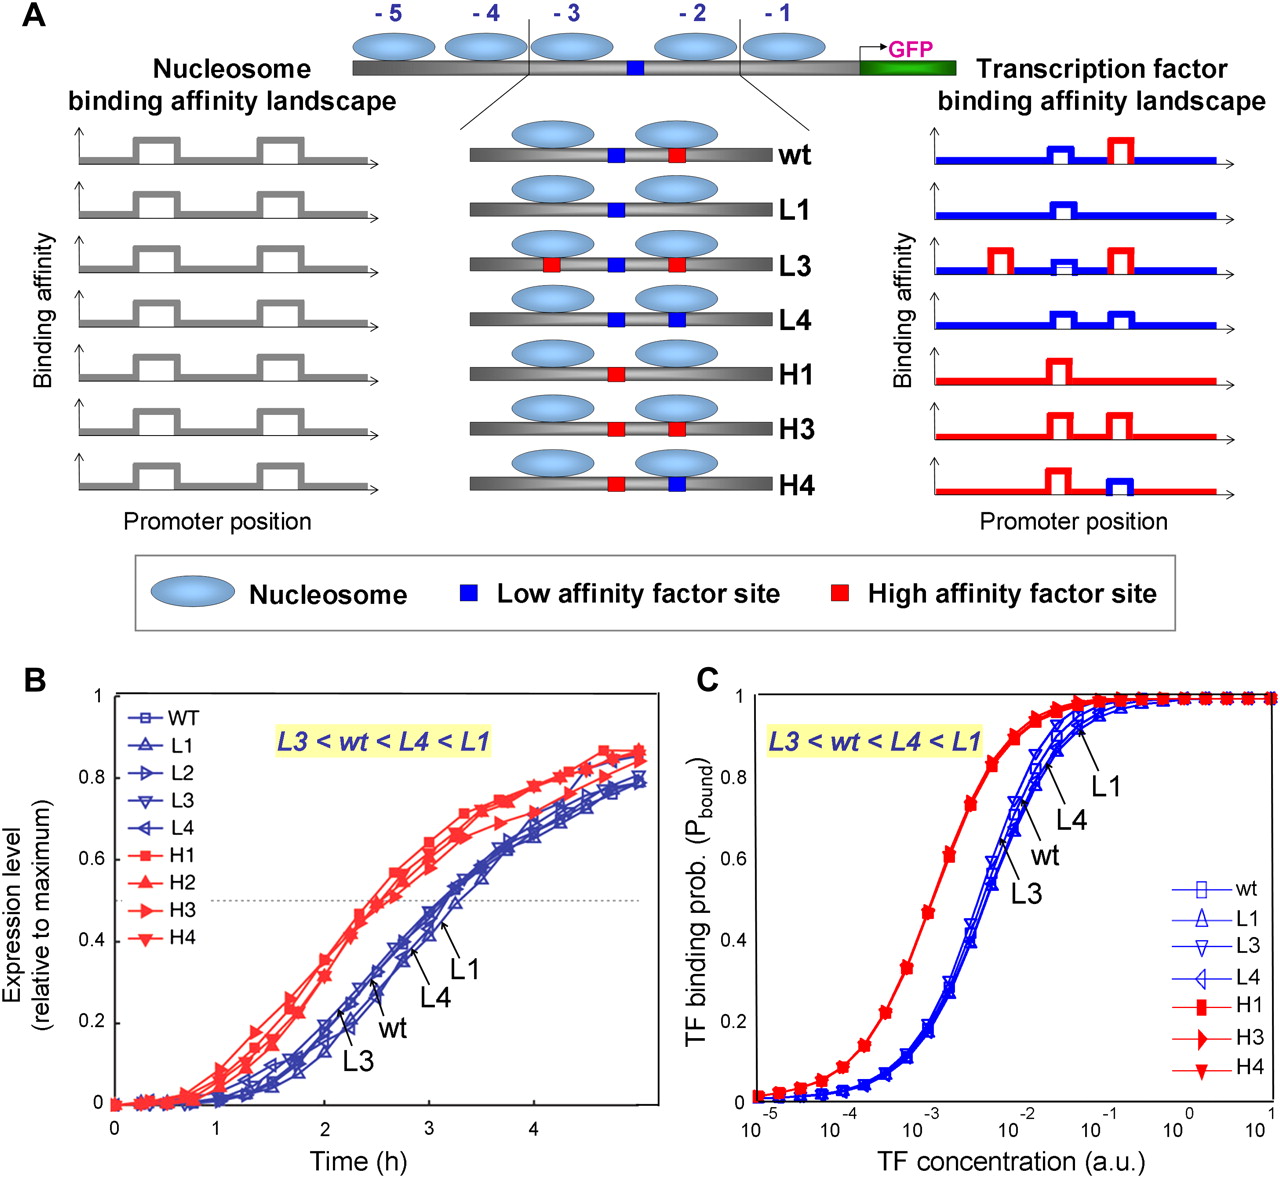
Predicted and observed activation curves for the PHO5 promoter variants. (A) The PHO5 promoter variants constructed by Lam et al. (2008), in which wild-type Pho4p sites were engineered to create various combinations of high- and low-affinity sites for the transcription factor, which were either exposed or covered by the −2 and −3 nucleosomes. For each variant, shown is a schematic representation of its binding affinity landscapes for transcription factors and nucleosomes. We excluded variants L2 and H2 since they are identical (because of symmetry) under our model to variants wild type and H3, respectively. (B) Experimental measurements by Lam et al. (2008) of the expression curves (scaled to maximum expression) of each variant following Pi starvation. [Reprinted with permission from Macmillan Publishers Ltd. © 2008, Lam et al. 2008.] (C) Prediction of the binding probability of Pho4p, Pbound, generated by applying our thermodynamic framework to each of the promoter variants from A at increasing Pho4p concentrations. In B and C, the yellow inset indicates the relative ordering of the onset times of the promoter variants with exposed low-affinity sites, where in both cases L3 is activated first, followed by wild type, L4, and L1. The energetic contribution ( ) from transcription factor binding is set to 860 for a strong site, and 200 for a weak site, in accordance with the 4.3 ratio between strong and weak Pho4p sites reported in Lam et al. (2008).