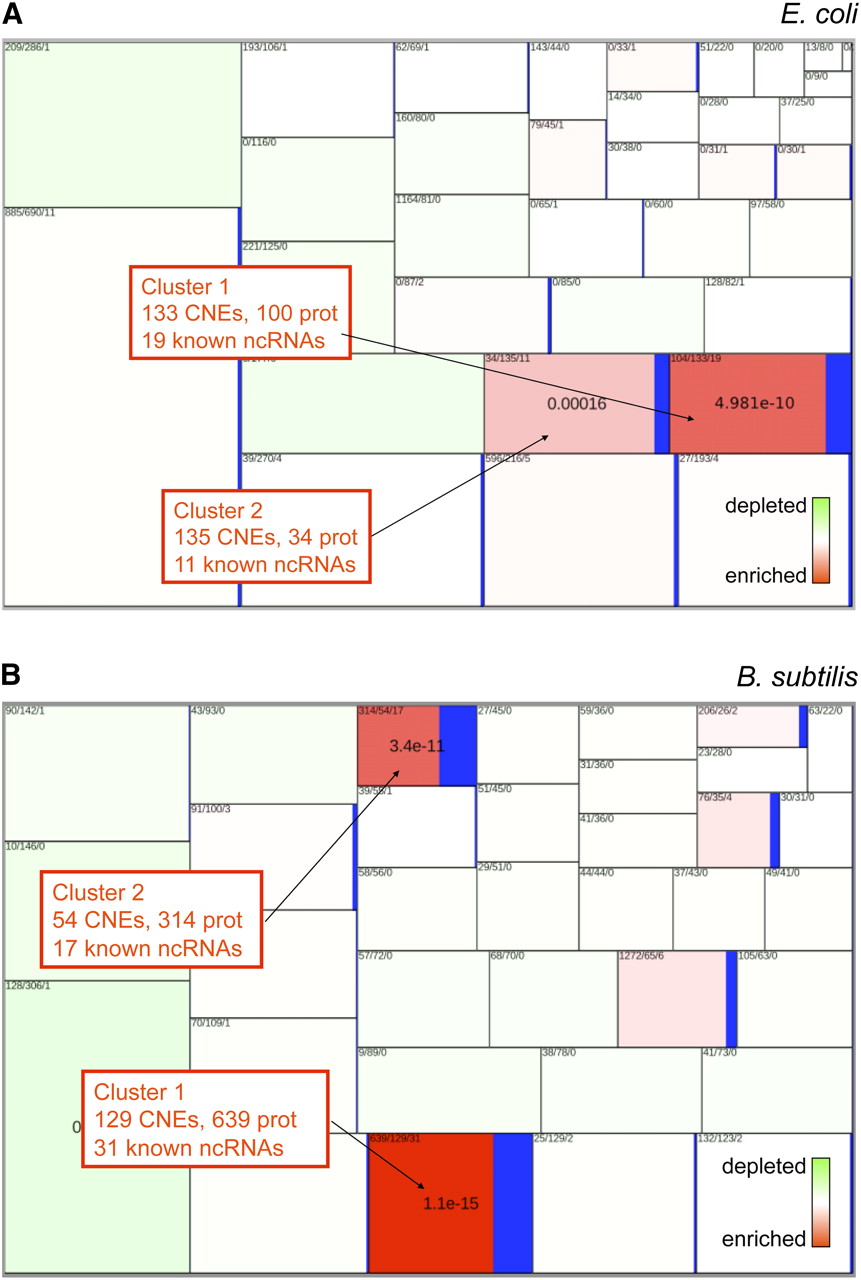
Figure 2.
K-means clustering of CNEs and CDSs in (A) E. coli and (B) B. subtilis. A rectangle represents a cluster of CNEs/CDSs, and its size is proportional to the number of CNEs in the cluster. Numbers in each rectangle represent numbers of protein coding genes, CNEs and known ncRNA in this cluster, respectively. The color scale represents the enrichment/depletion of known ncRNA in each cluster. For ncRNA-rich clusters, the enrichment P-value is shown in the center of the rectangle. ncRNA enrichment measures do not include tRNA or rRNA.