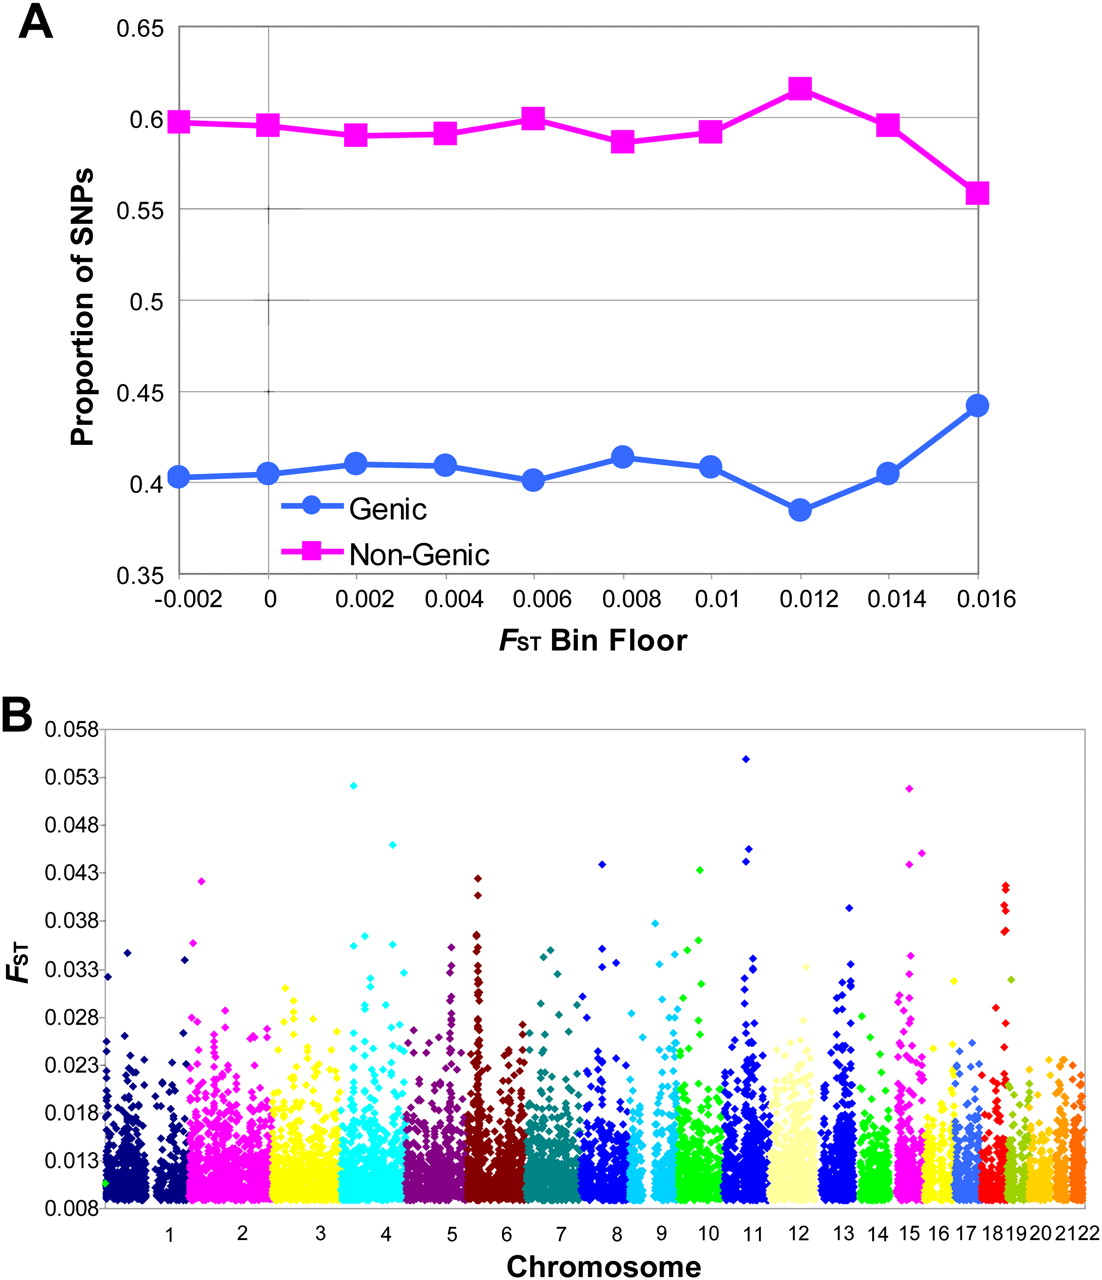
Figure 2.
Northern European FST values by genomic location. (A) Proportion of SNPs that are inside (genic) or outside (nongenic) genes by FST bin category. X-axis FST values refer to the lower boundary of the bin. (B) Genome-wide distribution of the top 10,000 FST (>0.00888) values by chromosome and genomic position.