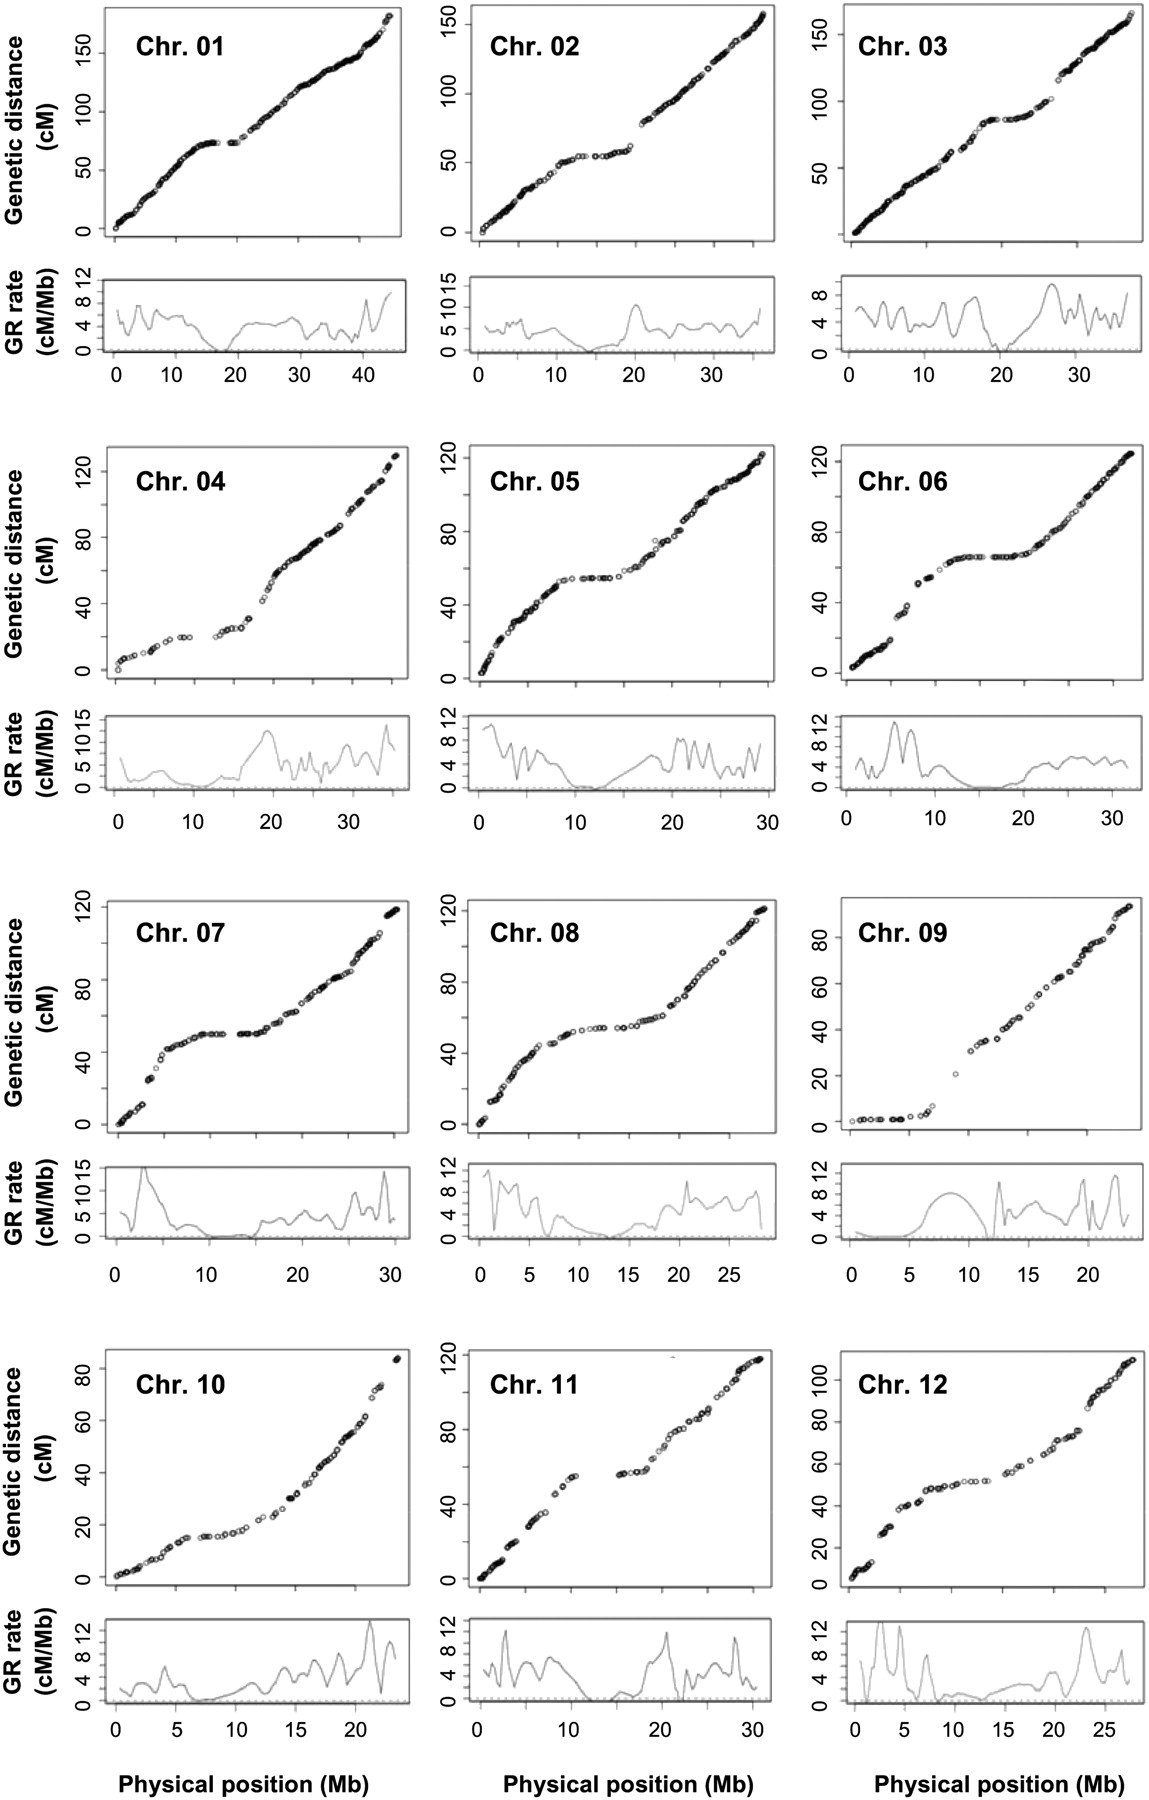
Figure 2.
Genetic and physical maps of the 12 rice chromosomes and the estimated local GR rates. For each chromosome, circles represent the genetic and physical positions of markers. The curves below the marker plots represent the estimated local GR rates.