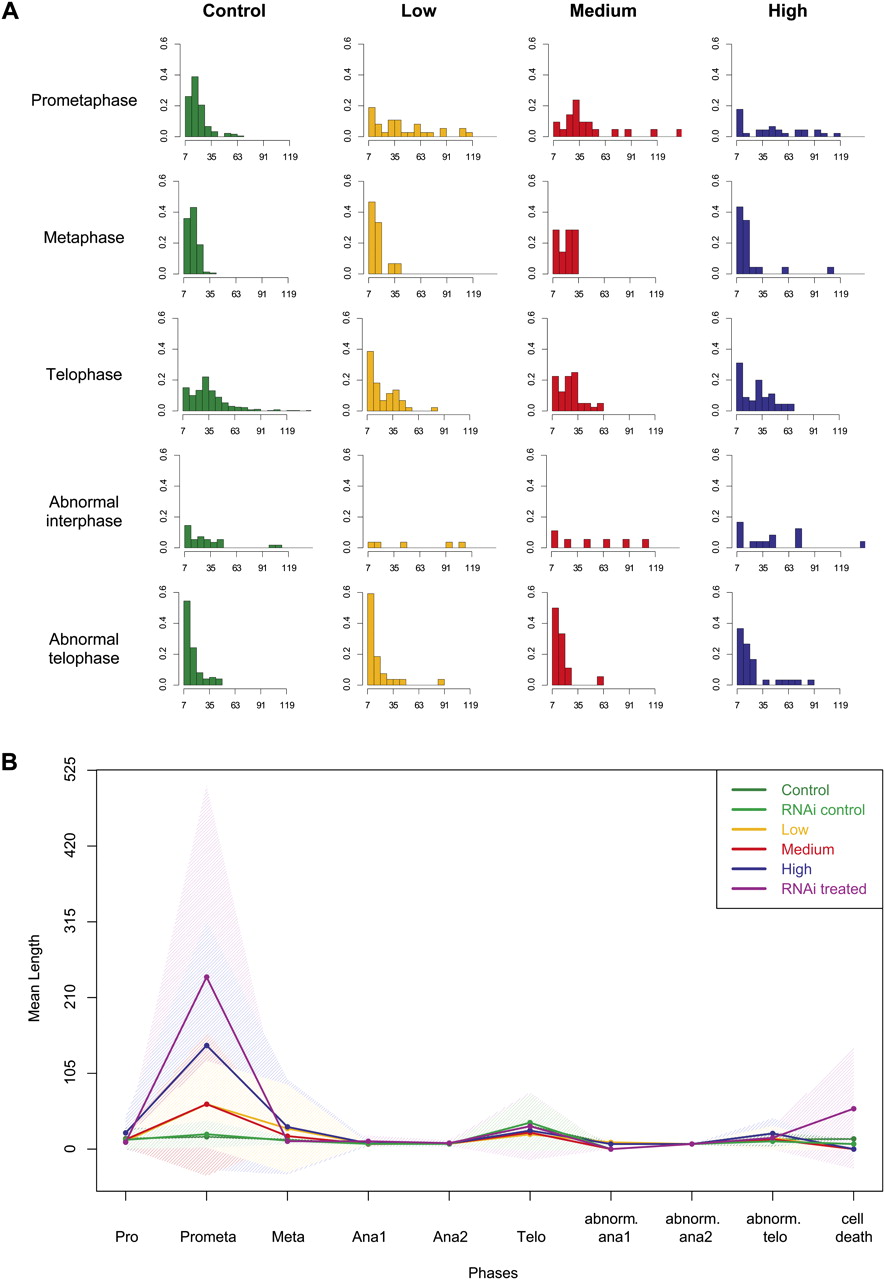
Figure 2.
Automatically computed phase lengths. (A) Phase length histograms for automatically annotated data. X-axis, phase length (min); y-axis, relative frequency. Histograms are displayed for a maximum length of 140 min (20 time steps). (B) Mean phase lengths (min.) for the automatically annotated data for all treatments and controls. The shaded regions indicate the standard deviations.