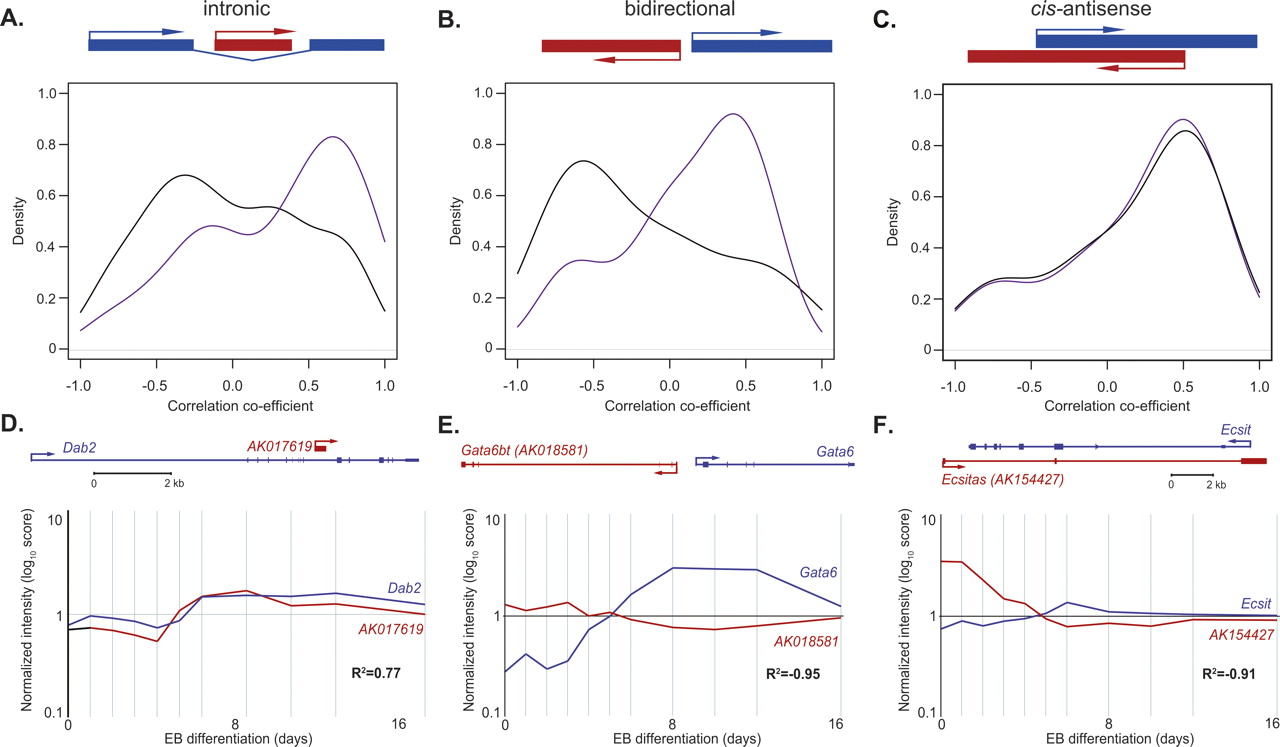
Figure 2.
Correlation of expression between ncRNAs and associated protein-coding genes. (A–C) Density plots of correlation coefficients between the expression of ncRNAs and their associated intronic (A), bidirectional (B), or cis-antisense (C) protein-coding gene (purple line) and randomized pairs (black line). (D–F) Examples of correlated (positive or negative) expression between ncRNAs (red) and the associated protein-coding genes (blue). The upper panel shows the genomic region of the ncRNA (GenBank accession nos. indicated) and protein-coding gene; the lower panel shows the corresponding expression profiles with Pearson’s correlation coefficients (R2) as indicated. Arrows indicate the direction of transcription.