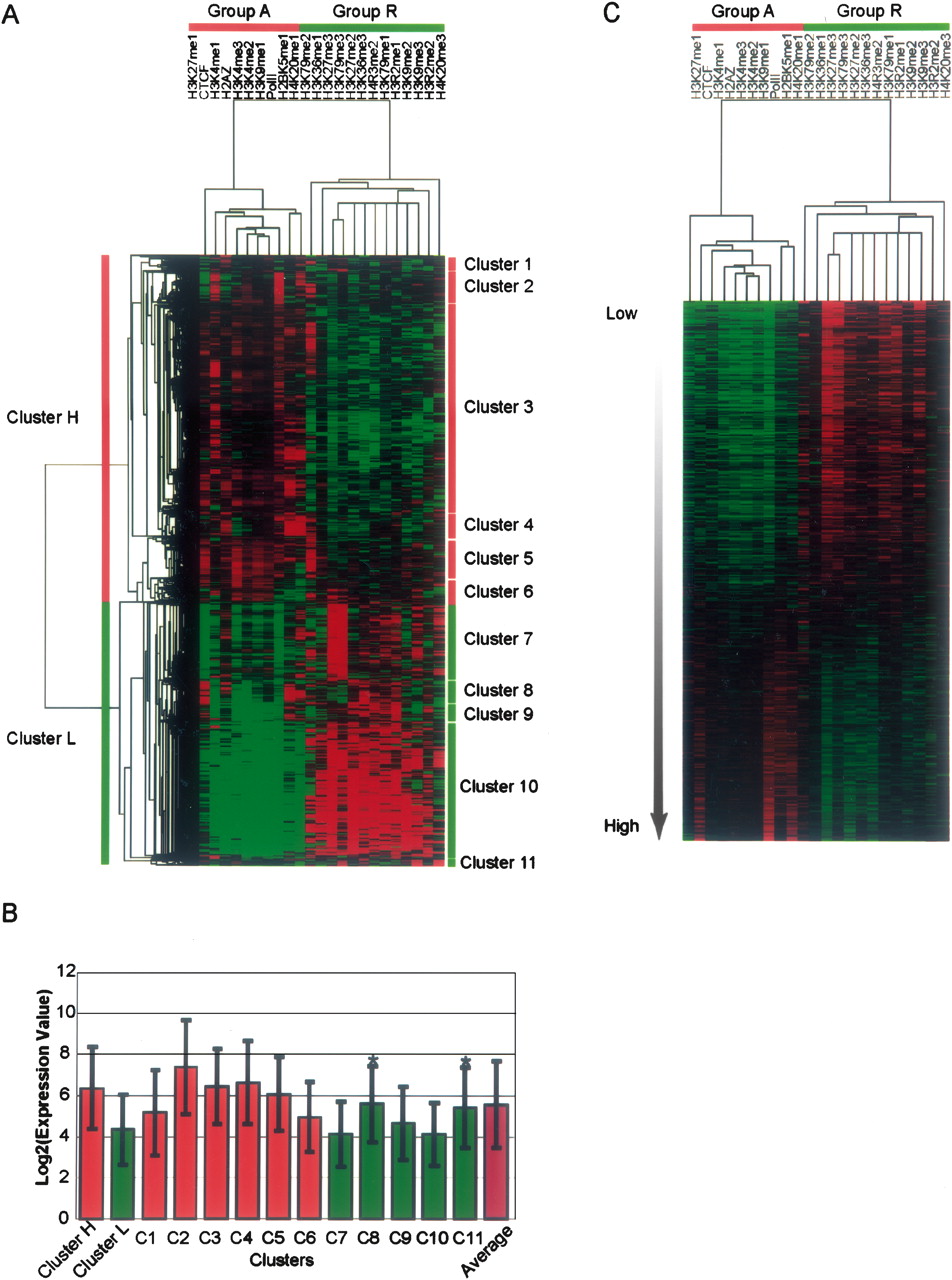
Two major groups of genes regulated by histone modifications. (A) Based on the histone modification counts within 1 kb upstream of and downstream from the transcription start site (TSS), two major groups of modifications can be detected as two major clusters above the heat plot. One group contains the known transcription activating binding/modifications, such as Pol II, H2A.Z, H3K4 mono-, di-, and trimethylations, while the other contains the known transcription repressing modifications, such as H3K27me3, H3K9me3, H3K79me3, and H4K20me3. (B) When the expression levels in T cells are compared, genes in the group with activating modifications (Cluster H) and those in the other group with repressive modifications (Cluster L) are, respectively, 1.14 and 0.78 times of the average log2 transformed expression levels of all genes measured on the microarray (both P < 1.62 × 10⁻¹²). An asterisk above a bar indicates that the group’s mean value is not significantly different from the average, otherwise the difference is significant. (C) Genes with measured expression levels are arranged from top to bottom according to increasing expression levels in T cells, as indicated by the gradient arrow.