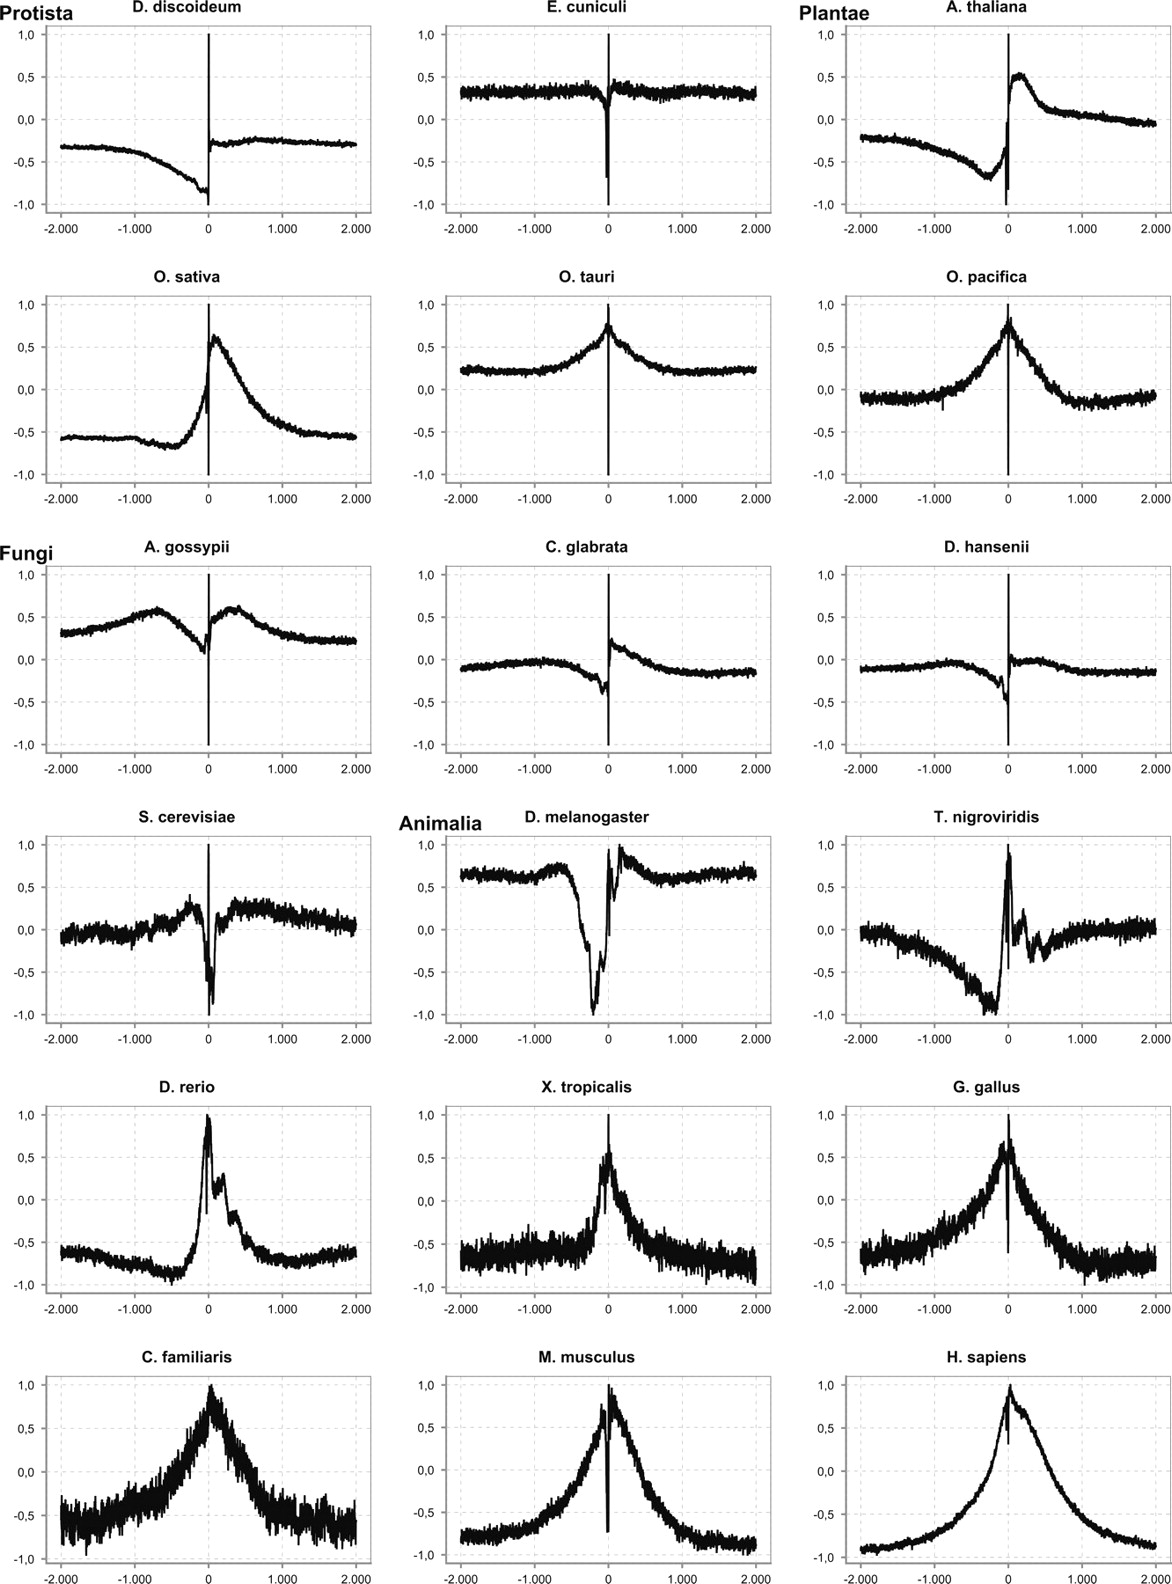
Figure 2.
Examples of numerical profiles representing different species using the same property (inverted base stacking value) over long-range distances around the transcription start site (TSS) (2000 bp upstream and 2000 bp downstream). (X-axis) Position relative to the TSS; (Y-axis) normalized value of the property. The profile is calculated with a window size of three.