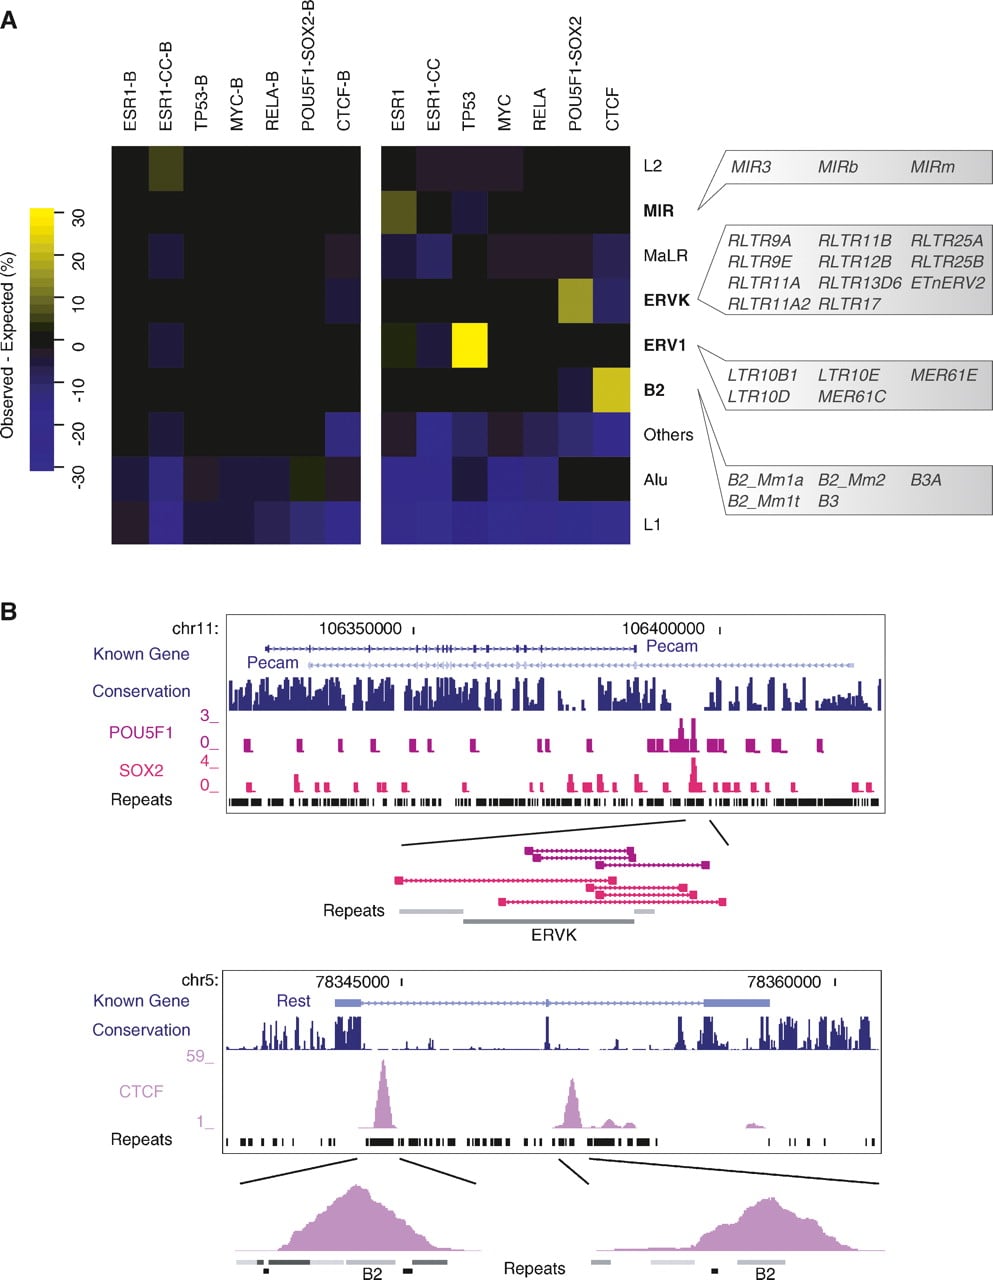
Pervasive association between transcription factor binding regions and transposable elements. (A) Enrichment of specific repeat families in the binding regions of distinct transcription factors. Heatmap shows the percentage of instances of a specific family of repeats that is in excess (yellow) or in deficit (purple) as compared to expected levels. Values were computed for the seven binding data sets but also for background data sets (labeled with “-B”) consisting of only singleton PETs (for ChIP-PET), random selected affymetrix probes (for ChIP-chip), or singleton tags (for ChIP-sequencing [ChIP-Seq]). The specific repeats from the four repeat families showing enrichment are highlighted on the right. These four repeat families are: MIR (mammalian interspersed repeat, a SINE repeat), ERVK (mouse endogenous retrovirus K, an LTR repeat), ERV1 (human endogenous retrovirus 1, an LTR repeat), and B2 (a rodent-specific SINE repeat). (B) Two examples showing ChIP sequencing clusters detecting binding regions in repeat-rich genomic sequences. In the first example, the binding region is identified with three fragments from the POU5F1 ChIP-PET library and four fragments from the SOX2 ChIP-PET library. In the second example, only the tag density is shown for the CTCF ChIP-Seq library.