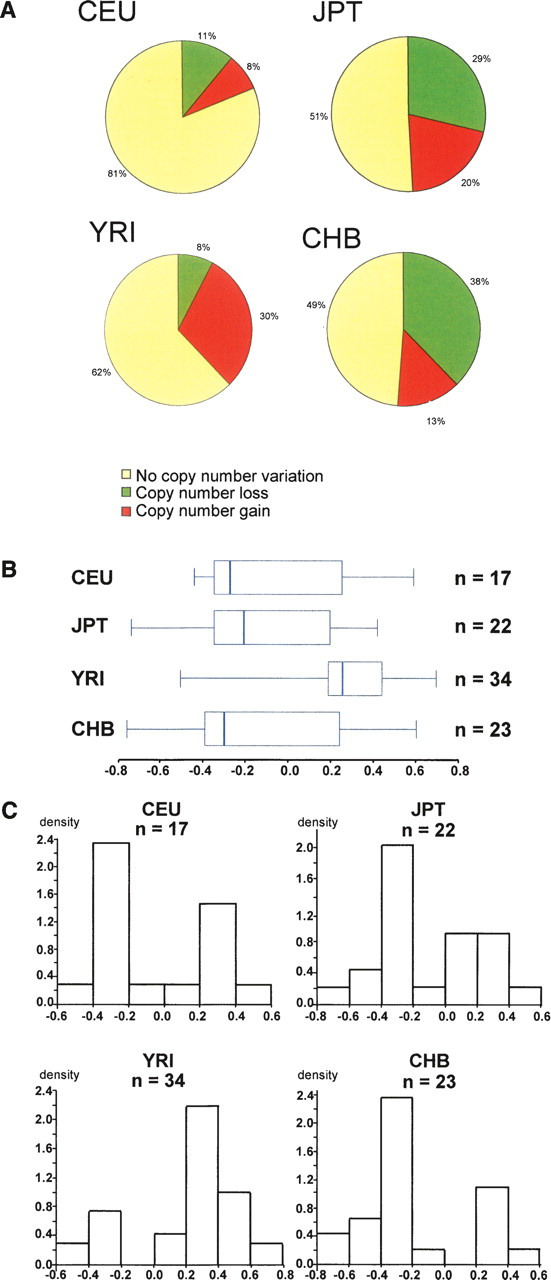
Figure 2.
Comparative analysis of REPA/REPB variation among HapMap populations using BAC-array CGH data from the Copy Number Variation project (http://www.sanger.ac.uk/humgen/cnv/data/). (A) Frequency of CNV in all 269 HapMap samples. (B,C) Variation range of the copy number HapMap samples classified with losses and gains according to Redon et al. (2006) and DGV. (B) Box plot graphic of the log2 intensity ratios. (C) Histogram of the log2 intensity ratios versus density. The density was calculated as the relative frequency of the log2 value data that have been grouped into a specified numeric interval. As the interval is equally wide, the bar’s height represents the relative frequencies.