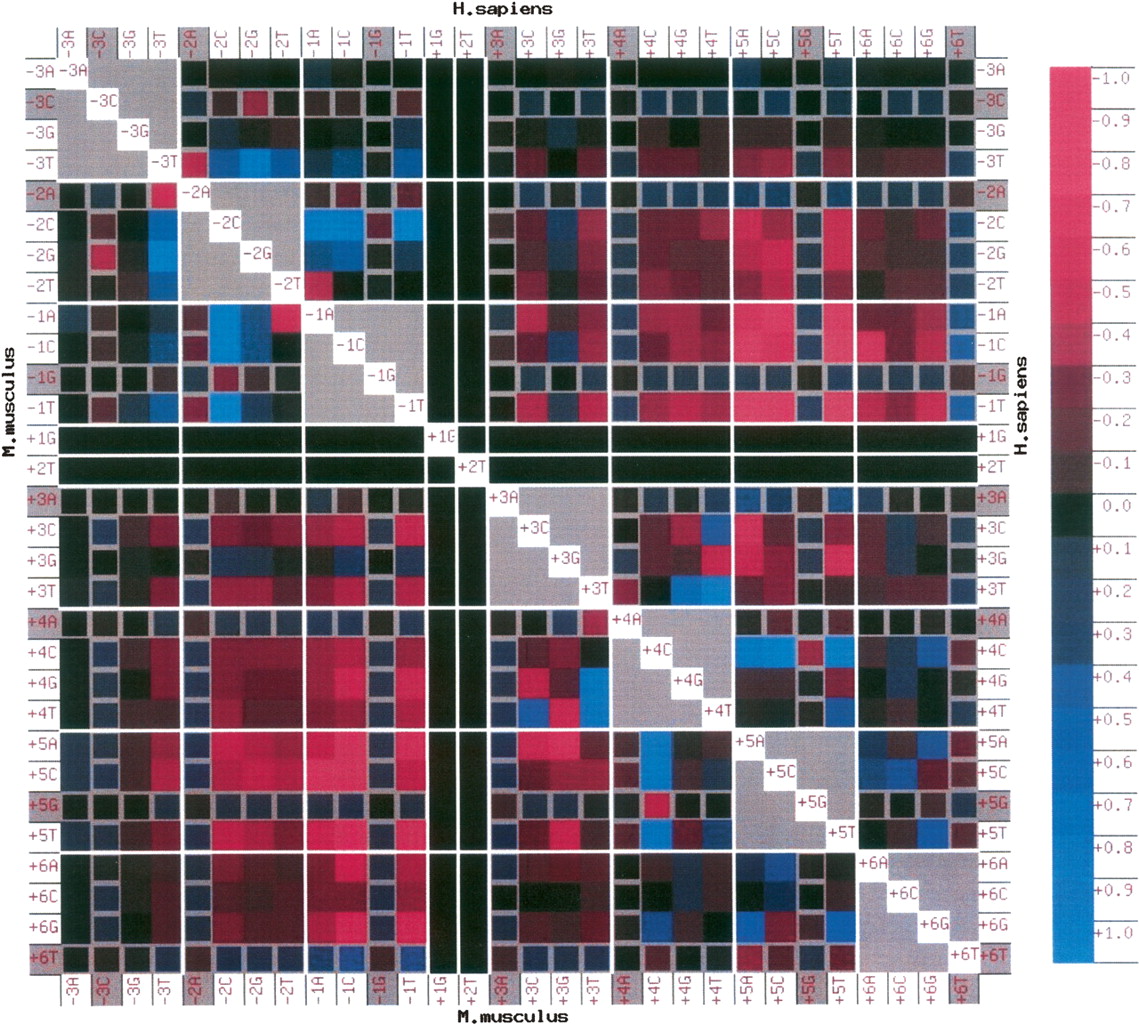
Association matrix for H. sapiens (upper right triangle, above diagonal) and M. musculus (lower left triangle, below diagonal). Row and column labels identify each square; e.g., the square identified by row −3A and column +5T represents the pair −3A+5T in human, as it lies in the upper right triangle. The color of the squares indicates the bias for (blue) or against (maroon) the pair of nucleotides. The log-odds score for each pair (the log of the ratio of actual versus expected counts) is calculated and scaled so that the maximum positive value is assigned a score of +1 and the minimum negative value is assigned a score of −1. The scale on the right shows the values indicated by the color tone. The diagonal elements are colored white, and gray is used for associations within a position. Gray borders are used to mark the rows and columns containing consensus nucleotides at any given position (e.g., +5G). A black square is used for the invariant (GT) dinucleotide at +1 and +2, and white lines are used to demarcate each position at the 5′ss. Note that the association matrices for M. musculus and H. sapiens are strikingly similar.